
Figure 5.
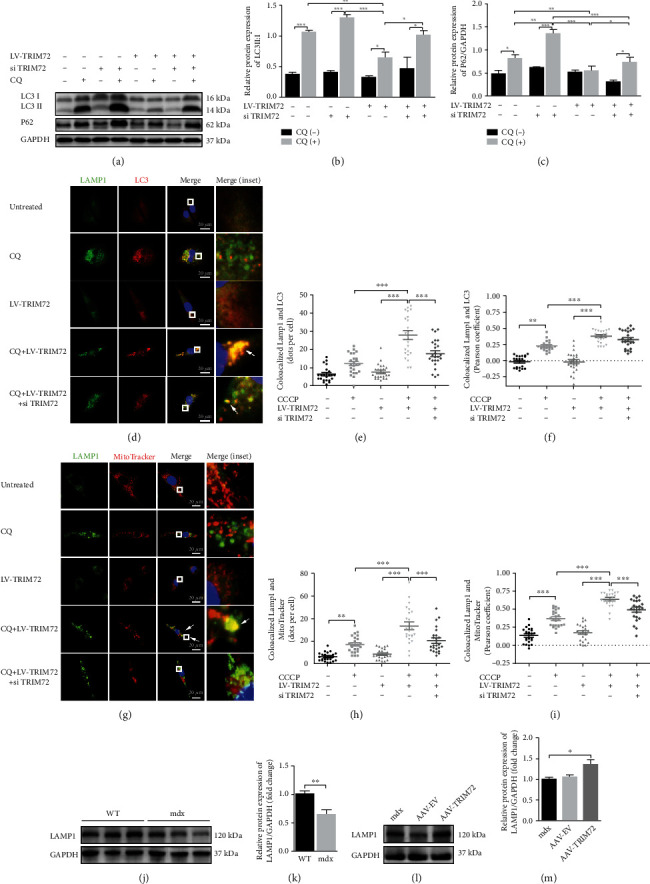
TRIM72 facilitated the late stage of mitophagy flux. (a–c) Western blot and statistical analysis of P62 and LC3 in C2C12 cells. Cells were cultured with or without CQ (10 μM), LV-TRM72, or si-TRIM72 for 72 h, n = 4. (d) Representative immunofluorescence images of LAMP1, LC3, and the merged images in C2C12 cells. Cells were cultured with or without CQ (50 μM), LV-TRM72, or si-TRIM72 for 24 h. Scale bar, 20 μm. (e, f) Statistical data of colocalized LAMP1 and LC3 was analyzed by Pearson's coefficient or dots per cell. (g) Representative immunofluorescence images of LAMP1, MitoTracker, and the merged images in C2C12 cells. Cells were cultured with or without CQ (50 μM), LV-TRM72, or si-TRIM72 for 24 h. Scale bar, 20 μm. (h, i) Statistical data of colocalized LAMP1 and MitoTracker was analyzed by Pearson's coefficient or dots per cell. (j, k) Western blot and quantification of LAMP1 in tibial anterior muscle of WT and mdx mice, n = 6. (l, m) Western blot and quantification of LAMP1 in tibial anterior muscle of blank, AAV-EV and AAV-TRIM72 treated mdx mice, n = 4. Scale bar, 50 μm. In (e, f) and (h, i), data were obtained from 24 randomly selected cells from 3 independent experiments. Data were expressed as mean ± SEM. ∗p < 0.05, ∗∗p < 0.01, and ∗∗∗p < 0.001.