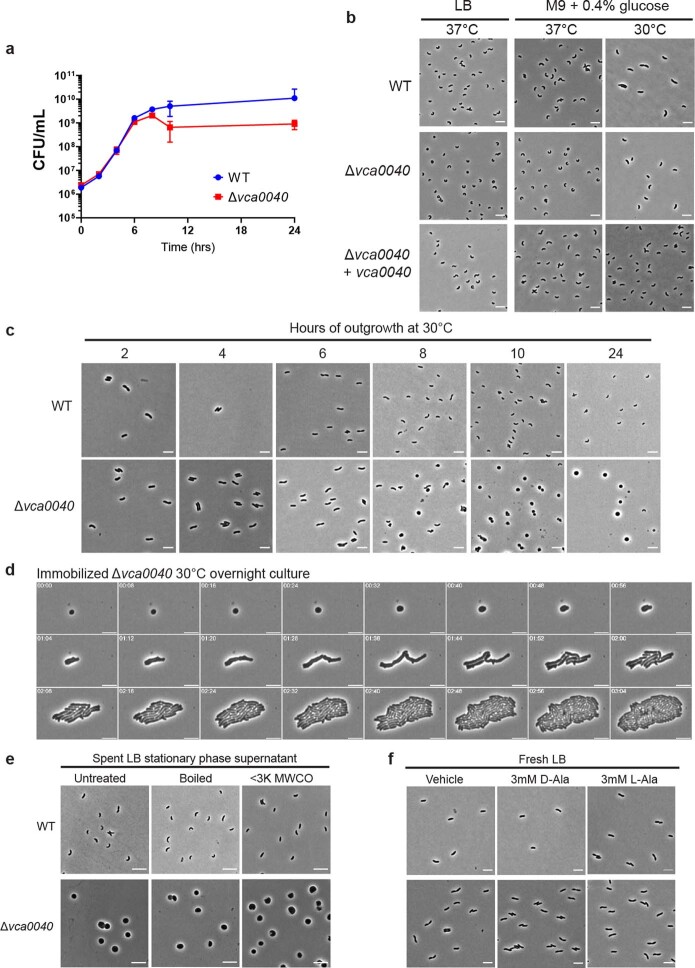
Extended Data Fig. 3. Growth and morphology of Δvca0040 V. cholerae.
(a): CFU plating time course of WT and Δvca0040 V. cholerae. Onset of stationary phase occurs after 6 h. (b): Phase-contrast imaging of WT, Δvca0040 and Δvca0040 + vca0040 V. cholerae in overnight cultures in the indicated conditions. (c): Phase-contrast imaging time course of the indicated strains grown in LB at 30 °C for the indicated amount of time. (d): Timelapse imaging of Δvca0040 cells immobilized on an agarose pad from a 30 °C overnight culture. Images were acquired over 3 h of growth. (e): Imaging of V. cholerae treated with normal, boiled (10 min) or filtered (<3K MW cutoff) cell-free spent supernatant for 4 h at 30 °C. (f): Imaging of V. cholerae treated with vehicle (DMSO) or 3 mM of D- or L-Ala in fresh LB for 4 h at 30 °C. a: mean ± SD of n = 3 independent cultures per strain. b, c, e, f: representative images of n = 3 independent cultures per strain/condition. d: representative timelapse of a single cell representative of >20 sphere-shaped bacteria across n = 3 separate fields of view from a single overnight culture. Scale bars: 3 (b,c,f) or 5 (d,e) µm.

