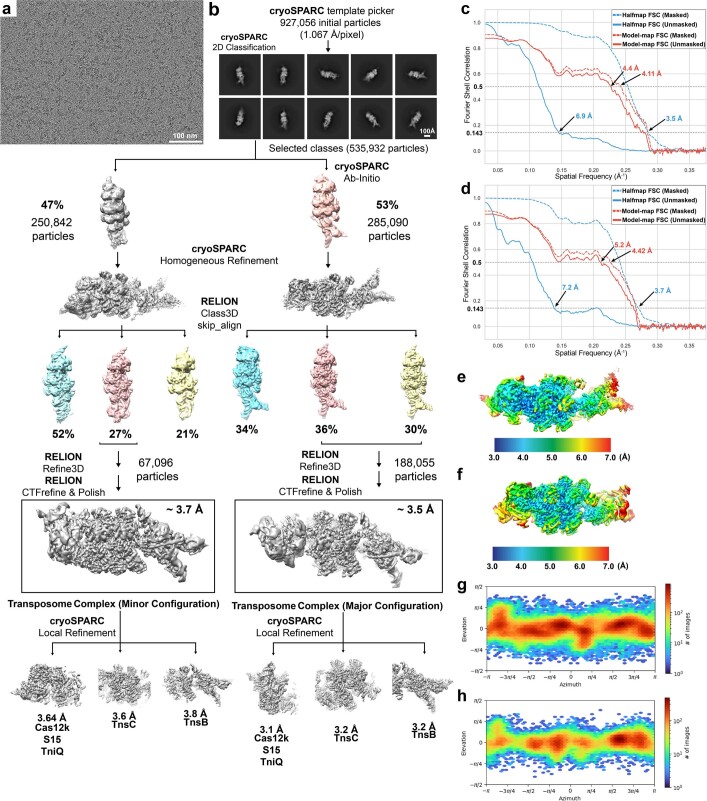
Extended Data Fig. 2. Cryo-EM imaging and image processing pipeline of the transpososome complex.
a. Representative cryo-EM micrograph from the reconstituted transpososome sample. Scale bar (white, bottom right) represents 100 nm. The micrograph shown is an example image from a full dataset consisting of 17,554 micrographs. b. Image processing workflow used to analyze the cryo-EM data. 2D classification in cryoSPARC v3.3.1 on template picked particles (from 14,017 micrographs) resulted in 535,932 particles. Ab-initio reconstruction on the initial particle stack resulted in two classes, one with 53% of the particles (pink) and the other with 47% of the particles (gray). The two classes were separated for subsequent classification and refinement steps. Before performing 3D classification in RELION v4, each class underwent homogenous refinement in cryoSPARCv3.3.135. RELION v4 3D classification (without alignments, skip_align)36,37 was applied to both populations from the ab-initio reconstruction resulting in the colored volumes shown (blue, pink, and yellow). On the left, the two classes (pink and yellow) that have the best resolved Cas12k density were combined for downstream refinement to produce the final 3D reconstruction (boxed), which is the major configuration of the transpososome complex with 12 TnsC protomers. Local refinement was performed on three different segments of the map, focusing on: Cas12k (3.1 Å), TnsC (3.2 Å) and TnsB (3.2 Å). On the right, the class that has the best resolved Cas12k and TnsB density (27% of particles, shown in pink) was selected for downstream refinement to produce the final 3D reconstruction (boxed), which is the minor configuration of the transpososome complex with 13 TnsC protomers. Similar local refinement was performed on three different segments of the minor TnsC complex to result in high resolution reconstructions of the target site proteins (Cas12k+TniQ+S15), TnsC, and TnsB. c-d. Fourier shell correlation (FSC) curve of the major (c) and minor (d) configuration of the transpososome complex, respectively. Masked (dashed) or unmasked (solid) gold standard half-map FSC (blue) and model-map FSC (red) curves are shown for the refined reconstruction and atomic model. Model-map cutoff (0.5) and gold-standard FSC cutoffs (0.143) are indicated with dashed lines. Estimated resolution based on these cutoffs are indicated. e-f. Local resolution filtered reconstruction for the major (e) and minor (f) configuration of the transpososome complex, respectively, are shown with estimated local resolution indicated using colored surface. Local resolution ranges from 3.0 Å (blue) to 7.0 Å (red). Legend at the bottom indicates local resolution range and values in Angstrom. g-h. Angular distribution plot for particle projections of the major (g) and minor (h) configuration of the transpososome complex, respectively. The plot was calculated in cryoSPARC v3.3.1 and shows the number of particles for each viewing angle. Colors indicate counts; red corresponds to high particle counts for that particular viewing angle, blue to low particle counts.

