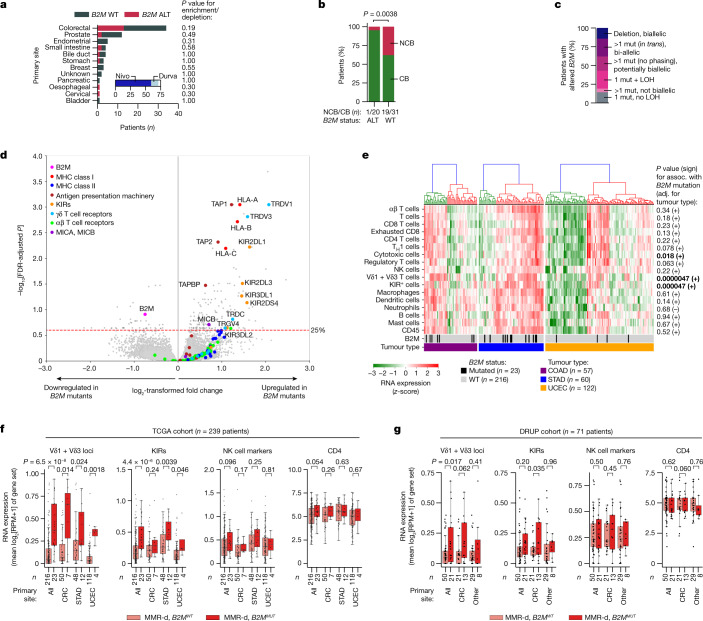
Fig. 1. In MMR-d cancers, B2M defects are positively associated with ICB responsiveness and infiltration by Vδ1 and Vδ3 T cells and KIR-expressing cells.
a, Tumour type distribution in the DRUP cohort (n = 71 patients). The colours denote patients’ B2M status; grey, WT; red, altered (ALT). P values for the enrichment/depletion of B2M-altered tumours per primary site were calculated using two-sided Fisher’s exact tests. The inset denotes the ICB treatment; dark blue, nivolumab (Nivo); light blue, durvalumab (Durva). b, B2M status (x axis) versus clinical benefit (green, CB; red, no clinical benefit (NCB)) of ICB treatment in the DRUP cohort. The P value was calculated using a two-sided Fisher’s exact test. c, The allelic status of B2M alterations in the DRUP cohort. Mut, mutation. d, Differential gene expression between B2MMUT and B2MWT MMR-d cancers in the TCGA COAD (colon adenocarcinoma; n = 57 patients), STAD (stomach adenocarcinoma; n = 60 patients) and UCEC (uterus corpus endometrial carcinoma; n = 122 patients) cohorts. The results were adjusted (adj.) for tumour type and multiple-hypothesis testing (Methods). e, Immune marker gene set expression in MMR-d cancers of the COAD, STAD and UCEC cohorts of the TCGA. The bottom two bars indicate B2M status and cancer type. The association (assoc.) between gene set expression and B2M status was tested using ordinary least squares linear regression (adjusted for tumour type; Methods), of which two-sided P values and the association sign are shown on the right. Cancers were ranked on the basis of hierarchical clustering (top dendrograms). P values less than 0.05 are in bold. f, Immune marker gene set expression in B2MWT (pink) and B2MMUT (red) MMR-d cancers in the TCGA COAD, STAD and UCEC cohorts separately or combined (all). Boxes, whiskers and dots indicate the quartiles, 1.5× the interquartile range (IQR) and individual data points, respectively. P values were calculated using two-sided Wilcoxon rank-sum tests. g, Immune marker gene set expression in B2MWT (pink) and B2MMUT (red) as described in f, but for MMR-d cancers in the DRUP cohort. Results are shown for all cancers combined, only CRC or all non-CRC cancers (other). Two-sided P values were calculated using linear regression, adjusting for biopsy site and tumour type (Methods).

