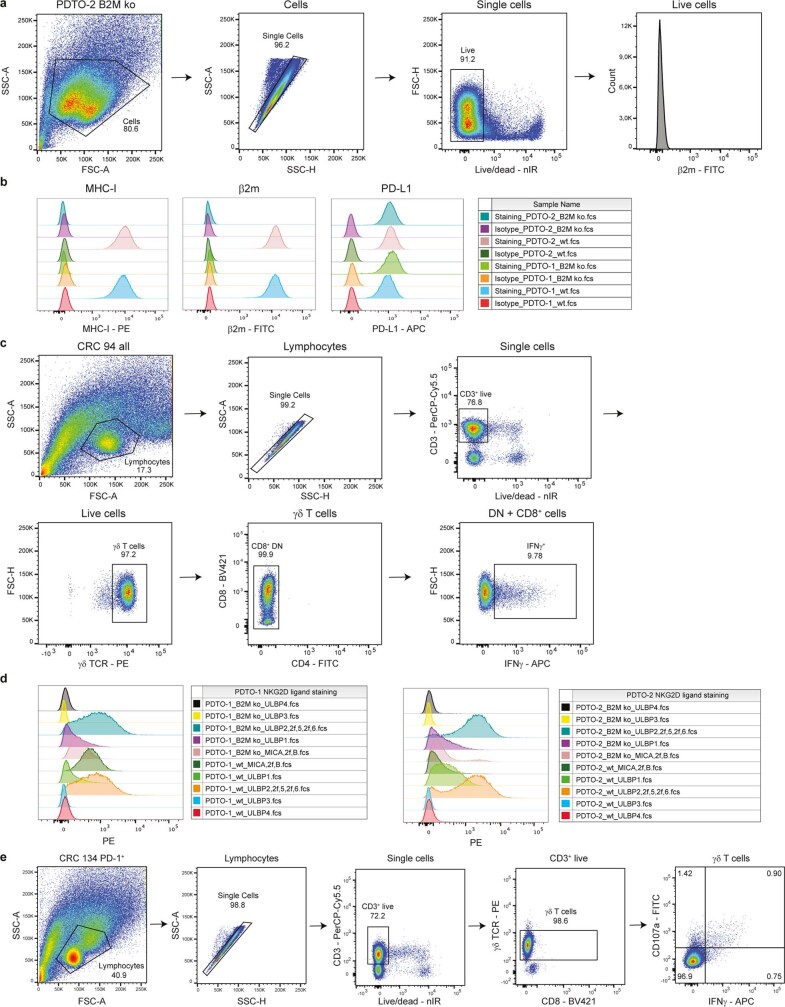
Extended Data Fig. 7. Tumour organoid characterization and reactivity assay readout.
a. Flow cytometry gating strategy on PDTO cells for analysis of surface staining. Selected cells were gated on single, live cells before quantification of staining signal. b. Histogram representation and count for surface staining of MHC-I, PD-L1, and β2m expression on two PDTO lines B2MWT and B2MKO after IFNγ pre-stimulation. Staining with isotype antibodies for each fluorochrome (PE, APC and FITC) were included as negative control. c. Flow cytometry gating strategy on γδ T cell samples for analysis of intracellular staining to test antitumour reactivity upon PDTO stimulation. Lymphocyte population was further gated on single cells, live and CD3+ cells, γδTCR+ cells and CD8+ as well as CD8–CD4– cells. Reactivity of the sample was based on IFNγ+ cells of the selected population. d. Histogram representation and count for surface staining of NKG2D ligands MICA/B, ULBP1, ULBP2/5/6, ULBP3, and ULBP4 on two PDTO lines B2MWT and B2MKO after IFNγ pre-stimulation. e. Flow cytometry gating strategy on γδ T cell samples for analysis of intracellular staining after stimulation with PDTOs in the presence of NKG2D ligand blocking. Lymphocyte population was further gated on single cells, live and CD3+ cells, followed by γδTCR+ and CD8+ as well as CD8– cells. Reactivity of final population was based on IFNγ+ or CD107a+ cells.

