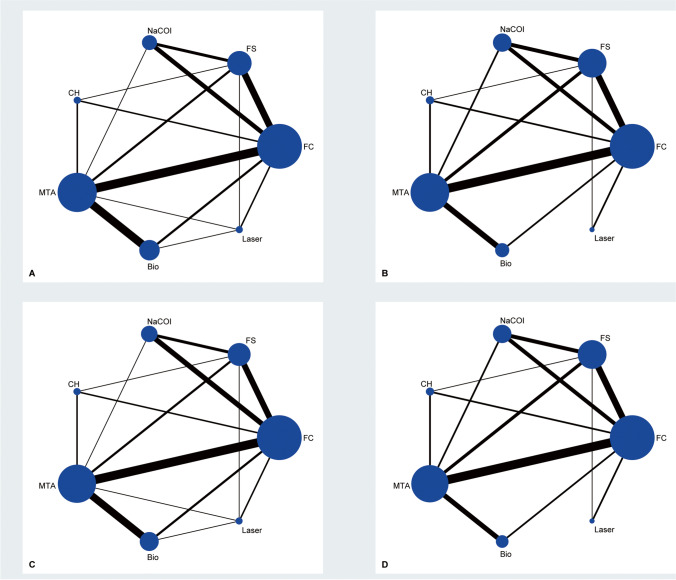
Fig. 2.
Network plot of clinical success at 6 (A) and 12 (B) months as well as radiographic success at 6 (C) and 12 (D) months. The size of an individual node is proportional to the accumulated number of patients, and the thickness of individual line connecting two nodes is proportional to the number of direct comparisons. FC, formocresol; FS, ferric sulfate; NaOCl, sodium hypochlorite; CH, calcium hydroxide; MTA, mineral trioxide aggregate

