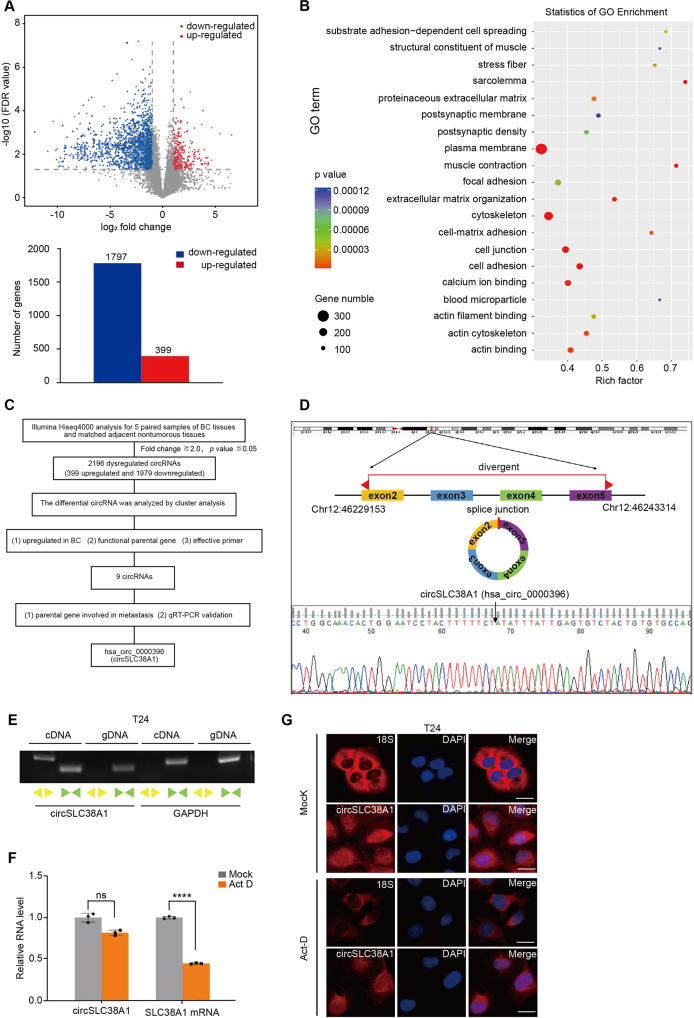
Fig. 1. circRNA expression profiles in BC.
A Top: volcano plot of the differentially expressed circRNAs in five pairs of BC tissues and corresponding adjacent nontumorous tissues by RNA-seq analysis. X-axis: log2 ratio of circRNA expression levels between normal and tumor tissues. Y-axis: the false discovery rate value (−log10 transformed) of circRNAs. Bottom: a total of 2196 dysregulated circRNAs were identified in BC tissues, of which 399 circRNAs were upregulated and 1797 circRNAs were downregulated (P < 0.05 and fold change >2.0). B GO analysis for the 2196 dysregulated circRNAs. C The flowchart delineates the steps for identifying circRNAs in BC. D Illustration of the annotated genomic region of SLC38A1, the putative different mRNA splicing forms (linear splicing and ‘head-to-tail’ splicing), circSLC38A1 is back-spliced by exon 2–5 of SLC38A1. Sanger sequencing following PCR conducted using the indicated divergent flanking primers showed the ‘head-to-tail’ splicing of circSLC38A1 in T24 cells. E CircSLC38A1 and GAPDH were amplified from cDNA or gDNA from T24 cells with divergent and convergent primers, respectively. F Stability of circSLC38A1 and linear SLC38A1 in T24 cells with or without 2 μg/mL Act D treatment for 24 h compared by qRT-PCR. ****p < 0.0001, error bars represent three independent experiments. G FISH with junction-specific probe of circSLC38A1 and 18 S probe was used to detect the localization of circSLC38A1; scale bar: 25 μm.

