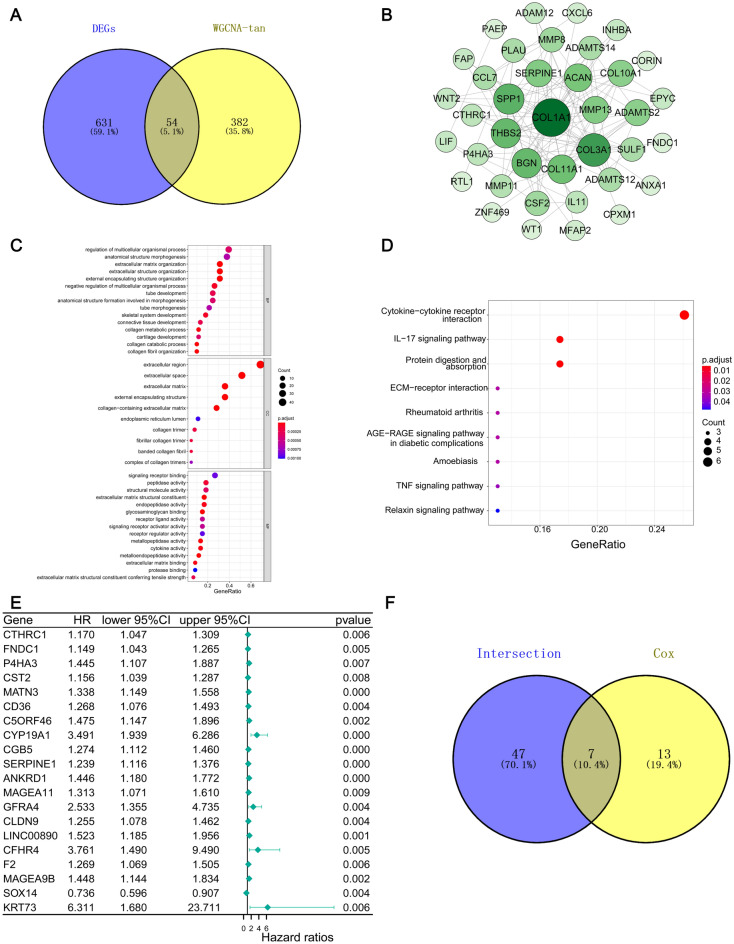
Figure 2.
Venn plots, Protein–protein interaction network, enrichment analysis of GO and KEGG for DEGs and Univariate Cox regression analysis. (A) Venn plot of the intersection of differential genes and tan modular genes. (B) 54 intersection genes interaction network constructed with the nodes with interaction confidence value > 0.4. (C) GO enrichment analysis of 54 intersection genes with p < 0.05. (D) KEGG enrichment analysis of 54 intersection genes with p < 0.05. Permission has been obtained from Kanehisa laboratories for using KEGG pathway database11. (E) 1504 DEGs single Univariate Cox regression analysis, listing the top significant factors with p < 0.01. (F) The Venn plot of the intersection of the intersection gene was obtained from the A diagram, and the intersection gene was obtained from the E diagram.

