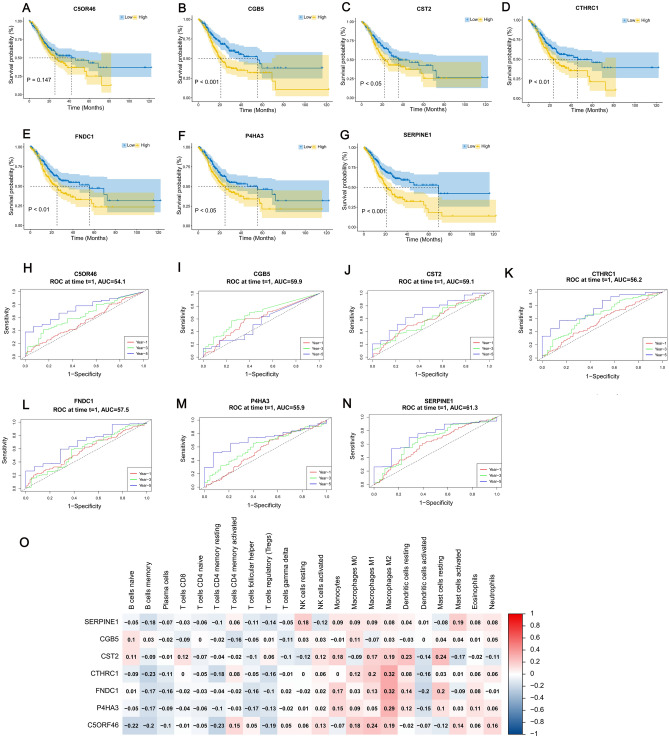
Figure 3.
Survival and Prognostic Analysis graphs and heat map for correlation analysis of hub genes. (A–G) Kaplan–Meier survival curves of 7 hub genes. The horizontal axis indicates the overall survival time in months, and the vertical axis represents the survival rate. P value < 0.05 was considered statistically significant. (H–N) Time-dependent ROC curves of 7 hub genes. Time-dependent ROC curves illustrate the prognostic value of the7 hub genes. (O) Heat map of correlation between 7 hub genes and immune cell. The heatmap was created by using “pheatmap” package in R4.1.2 (https://www.r-project.org/).

