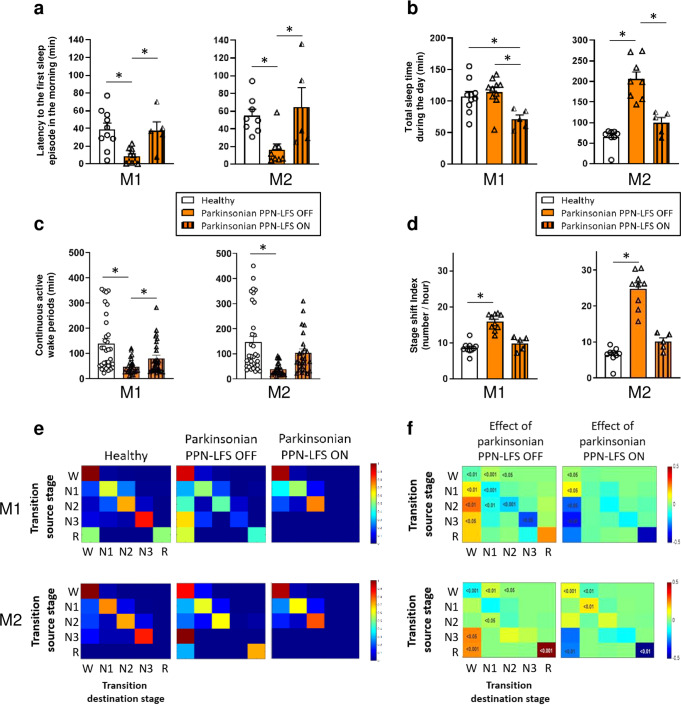
Fig. 4. Evaluation of PPN-LFS on excessive daytime sleepiness.
These evaluations were performed during healthy (white), parkinsonian PPN-LFS OFF (orange) and parkinsonian with PPN-LFS ON (orange with vertical lines) conditions. a Latency to the first sleep episode in the morning for M1 and M2, expressed in minutes (mean ± SEM). b Total sleep time during the day for M1 and M2, expressed in minutes (mean ± SEM). c Duration of continuous active wake periods for M1 and M2, expressed in minutes (mean ± SEM). d Stage shift index for M1 and M2, expressed in number of transition from one stage to another per hour (mean ± SEM). * p < 0.05 Kruskal–Wallis test followed by Dunn’s multiple comparisons test. e Typical example of matrices of transitions probabilities at healthy, parkinsonian PPN-LFS OFF and parkinsonian PPN-LFS ON. W = wake; 1,2,3= non-REM sleep stage N1, N2 and N3; R = REM sleep. f Transitions between wake and sleep stages, source stage (vertical) to destination stage (horizontal) according to the parkinsonian PPN-LFS OFF state (left) and the parkinsonian PPN-LFS ON state (right). Numbers in the matrices are the significant p values obtained with Wilcoxon rank sum test.

