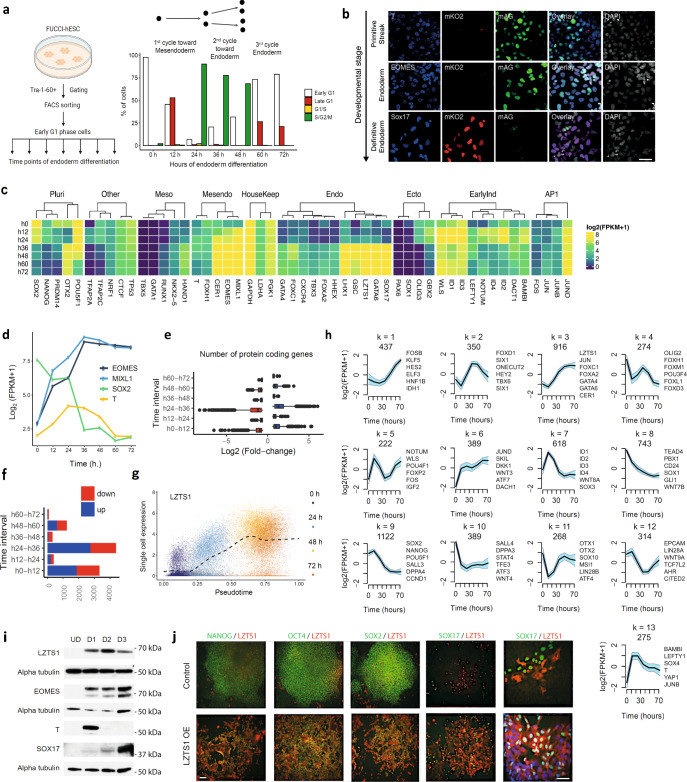
Fig. 1. Differentiation of cell cycle synchronised hESCs reveals that each cell division results in a new cellular identity.
a Schematic representation of experimental setup to differentiate synchronised EG1-FUCCI hPSCs into endoderm. The bar plot indicates the proportion of cells in the population at each cell cycle phase and time point. The schematic representation was created with BioRender.com. b Immunofluorescence analyses showing expression of the primitive streak (T, 36 h), early-endoderm (EOMES, 48 h) and definitive endoderm (SOX17, 72 h) markers in FUCCI-hESCs differentiating into endoderm after synchronisation. For immunostaining, the scale bar represents 100 µm. c Gene expression analyses show stage-specific and selected genes that are differentially expressed upon differentiation. d Mean gene expression of T, EOMES, MIXL1 and SOX2 during the time course. e The number of differentially expressed genes (FC >1.5; FDR ≤0.01), and f distribution of log2 fold changes during endoderm differentiation. In (e), the boxes show the interquartile range, with the median marked as a heavy vertical band. Whiskers represent the highest (lowest) datapoint within 1.5 times the interquartile range of the 75th (25th) percentile. Outliers are plotted separately as individual points beyond the whiskers on the boxplot. Data in (e) depicts n = 3 biologically independent samples over an independent experiment. g Single-cell expression (y-axis) of LZTS1, plotted along pseudotime (x-axis). The black dashed line indicates the smoothed mean. Gene expression values correspond to log2(CPM + 1). h Average pattern of gene expression of the 13 clusters identified by k-means clustering. Representative genes are shown beside each cluster. The y-axis represents row-scaled log2(FPKM + 1). The interval represents two standard deviations from the mean. i Western blot analyses show the expression of mesendoderm markers (T), endoderm markers (SOX17, EOMES) and LZTS1 during the differentiation of hPSCs into endoderm. j Immunostaining showing the expression of pluripotency markers (NANOG, OCT4 and SOX2), endoderm markers (SOX17) and LZTS1 in hPSCs (control) and hPSCs overexpressing LZTS1 (LZTS1 OE). For immunostaining, the scale bars represent 100 µm. Source data are provided as a Source Data file.

