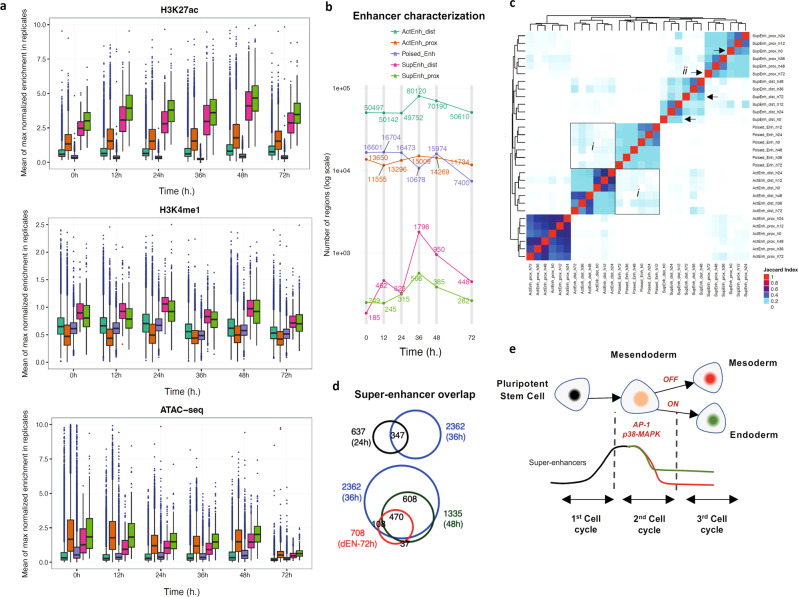
Fig. 6. Epigenome dynamics upon differentiation reveal super-enhancers assembly and loss to establish a new cellular identity.
a Distribution of H3K27ac, H3K4me1 and ATAC-seq signal in the enhancer regions shown in (b). The boxes show the interquartile range, with the median marked as a heavy horizontal band. Whiskers represent the highest (lowest) datapoint within 1.5 times the interquartile range of the 75th (25th) percentile. Statistical outliers are plotted separately as individual points beyond the whiskers on the boxplot. n = 2 biologically independent samples. b Enhancer classification during endoderm differentiation: ActEnh_dist (H3K27ac+, H3K4me1+, H3K4me3−, <3 kb); ActEnh_prox (H3K27ac+, H3K4me1+, H3K4me3+, <3 kb); Poised_Enh (H3K27ac−, H3K4me1+); SupEnh_dist (H3K27ac+, H3K4me1+, H3K4me3−, > 3 kb); SupEnh_prox (H3K27ac+, H3K4me1+, H3K4me3+, > 3 kb). c Hierarchical clustering of Jaccard Index values obtained for overlaps between different enhancer regions. The squares (i) highlight the conversion of poised into active enhancers, while the arrows (ii) indicate the similarity of super-enhancers at 0 and 72 h with other time points. d Endoderm-specific super-enhancers are a subset of those established at 36 h. e Schematic model of the super-enhancer establishment during endoderm differentiation at each consecutive cell division.

