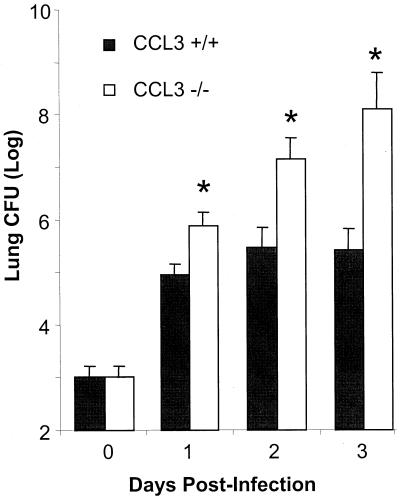
FIG. 2.
Pulmonary bacterial burden following infection of K. pneumoniae. CCL3−/− and CCL3+/+ mice (n = 10 to 12 per time point) were infected intratracheally with 103 CFU (day 0) of K. pneumoniae. Lung bacterial load was determined at days 1, 2, and 3 postinfection. Data are pooled from the results of three independent, matched infections. Bars represent the mean number of CFU per lung for each group ± standard error. Additionally, note that the y axis is in logarithmic scale. ∗, P < 0.002.

