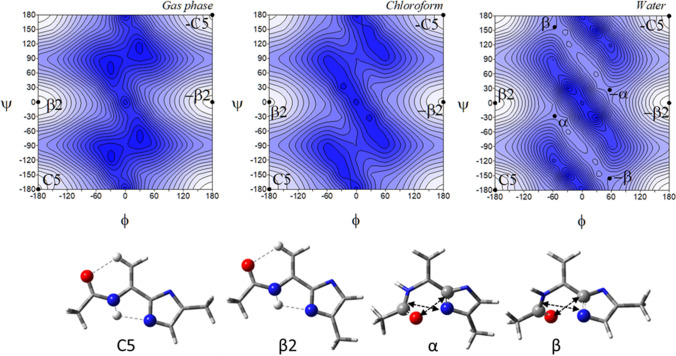
Fig. 10.
The potential energy surfaces E = f(φ,ψ) for Ac–ΔAla-[psi](Imz)−-4-Me (8) calculated at M06-2X/6–31+G(d,p) method in the gas phase, chloroform, and water. Energy contours are plotted every 1 kcal/mol. The darker colour indicates the high in energy regions and the lighter—low in energy. Below maps are conformations optimised in water with the most important electrostatic interactions (◄⋯►) and hydrogen bonds (⋯) created within the residue

