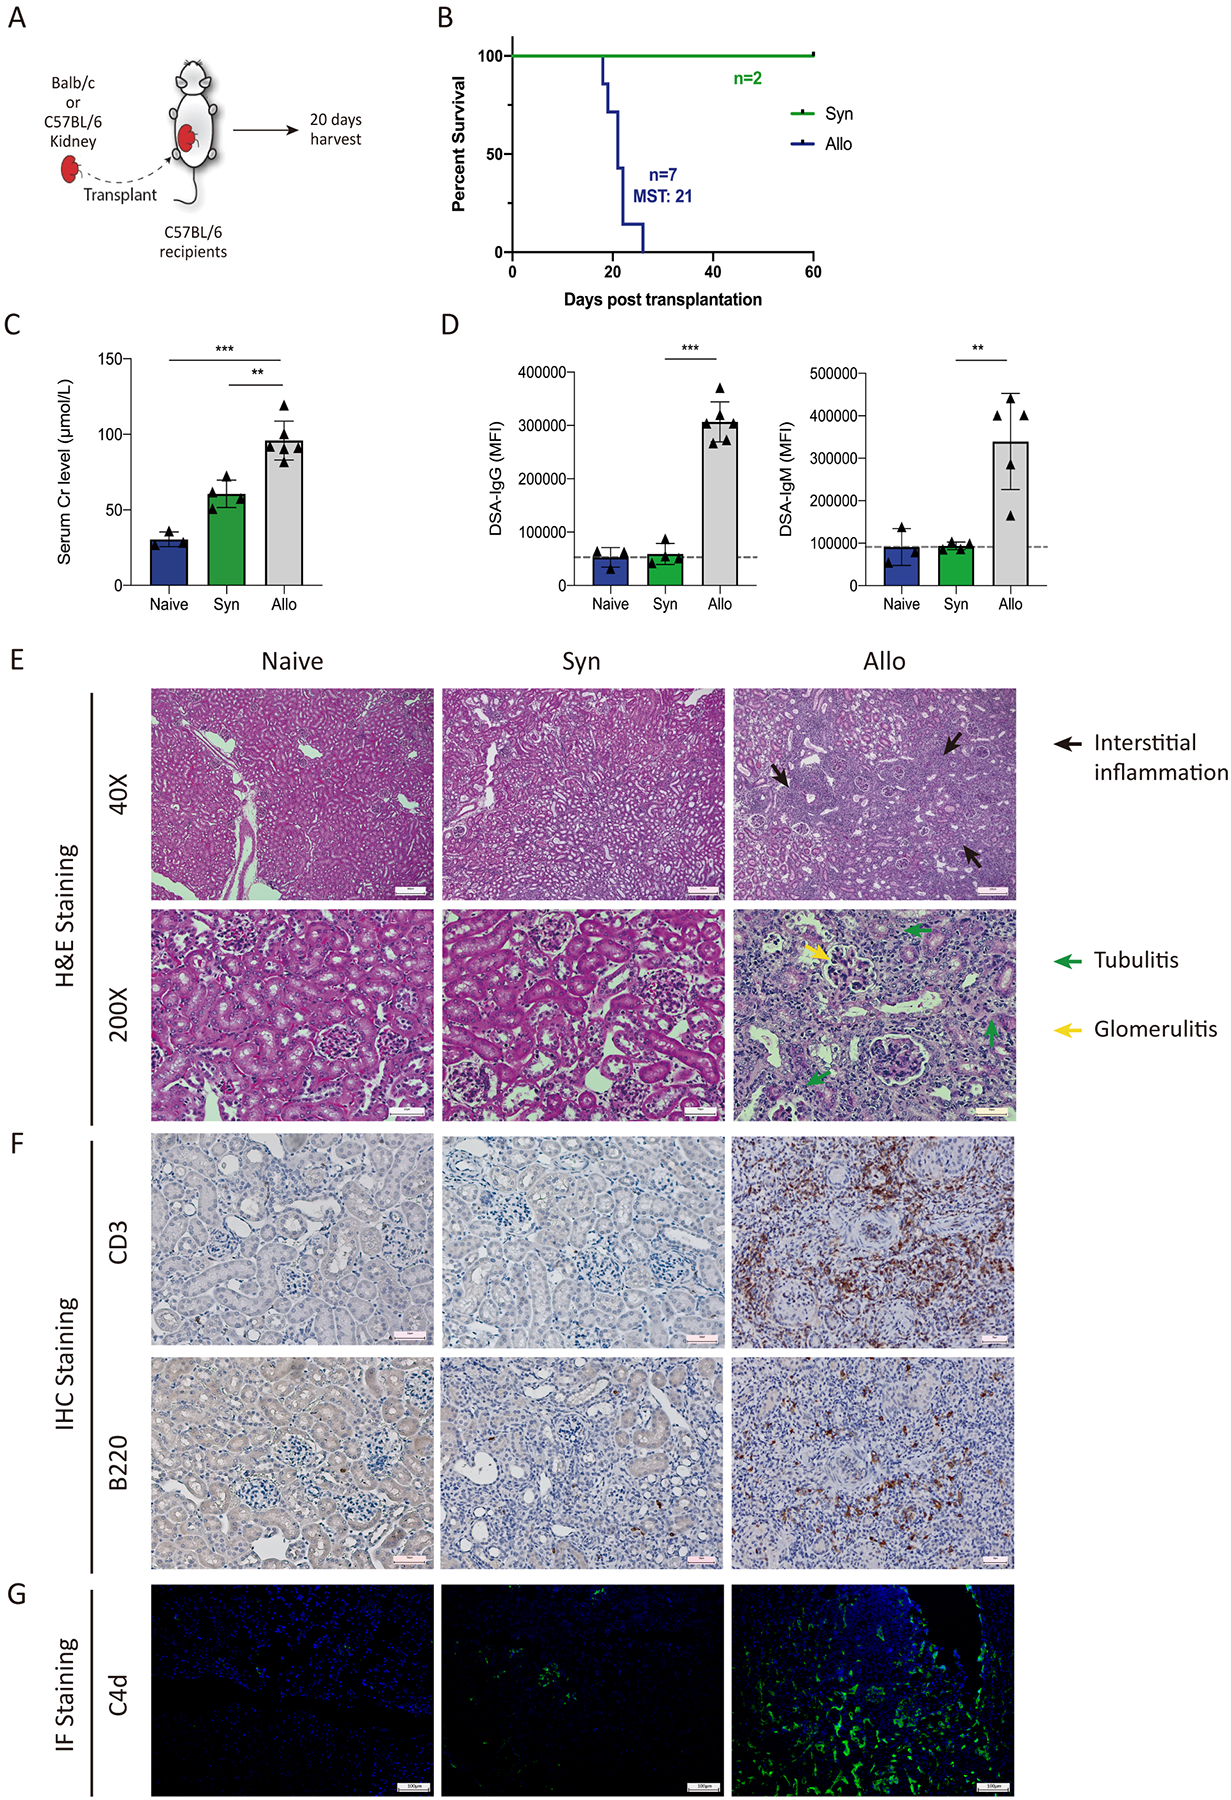
Figure 1. Characterization of rejection after allogeneic kidney transplantation.

(A) Diagram of the kidney transplantation experiment. C57BL/6 (syngeneic) or Balb/c (allogeneic) kidneys were transplanted into C57BL/6 recipients. The ureters of both native kidneys were ligated to remove native kidney function on day 2–4. 20 days after transplantation recipients were analyzed. (B) Survival of transplanted recipients between the syngeneic and the allogeneic group. MST, median survival time. (C) Serum creatinine levels of recipient mice. (D) DSA IgG and IgM measurements from serum samples. Dotted line indicates background levels using a syngeneic C57BL/6 probe. (E) Representative histological images of transplanted kidneys at postoperative day 20. Hematoxylin and eosin stain. Magnification: upper panels: 40x for renal interstitium observation, scale bars: 200 μm; lower panels: 200X for nephron observation, scale bars: 50 μm. (F) Immunohistochemistry staining for CD3 and B220 in transplanted graft tissues. Magnification: 200×, scale bars: 50 μm. (G) Representative immunofluorescence staining for C4d sedimentation in transplanted grafts. Magnification: 100×, scale bars: 100 μm. Data are from a single experiment and are representative of 3 independent repeats with n=4–5 mice per group. Statistics **: P < 0.01; ***: P < 0.001.
