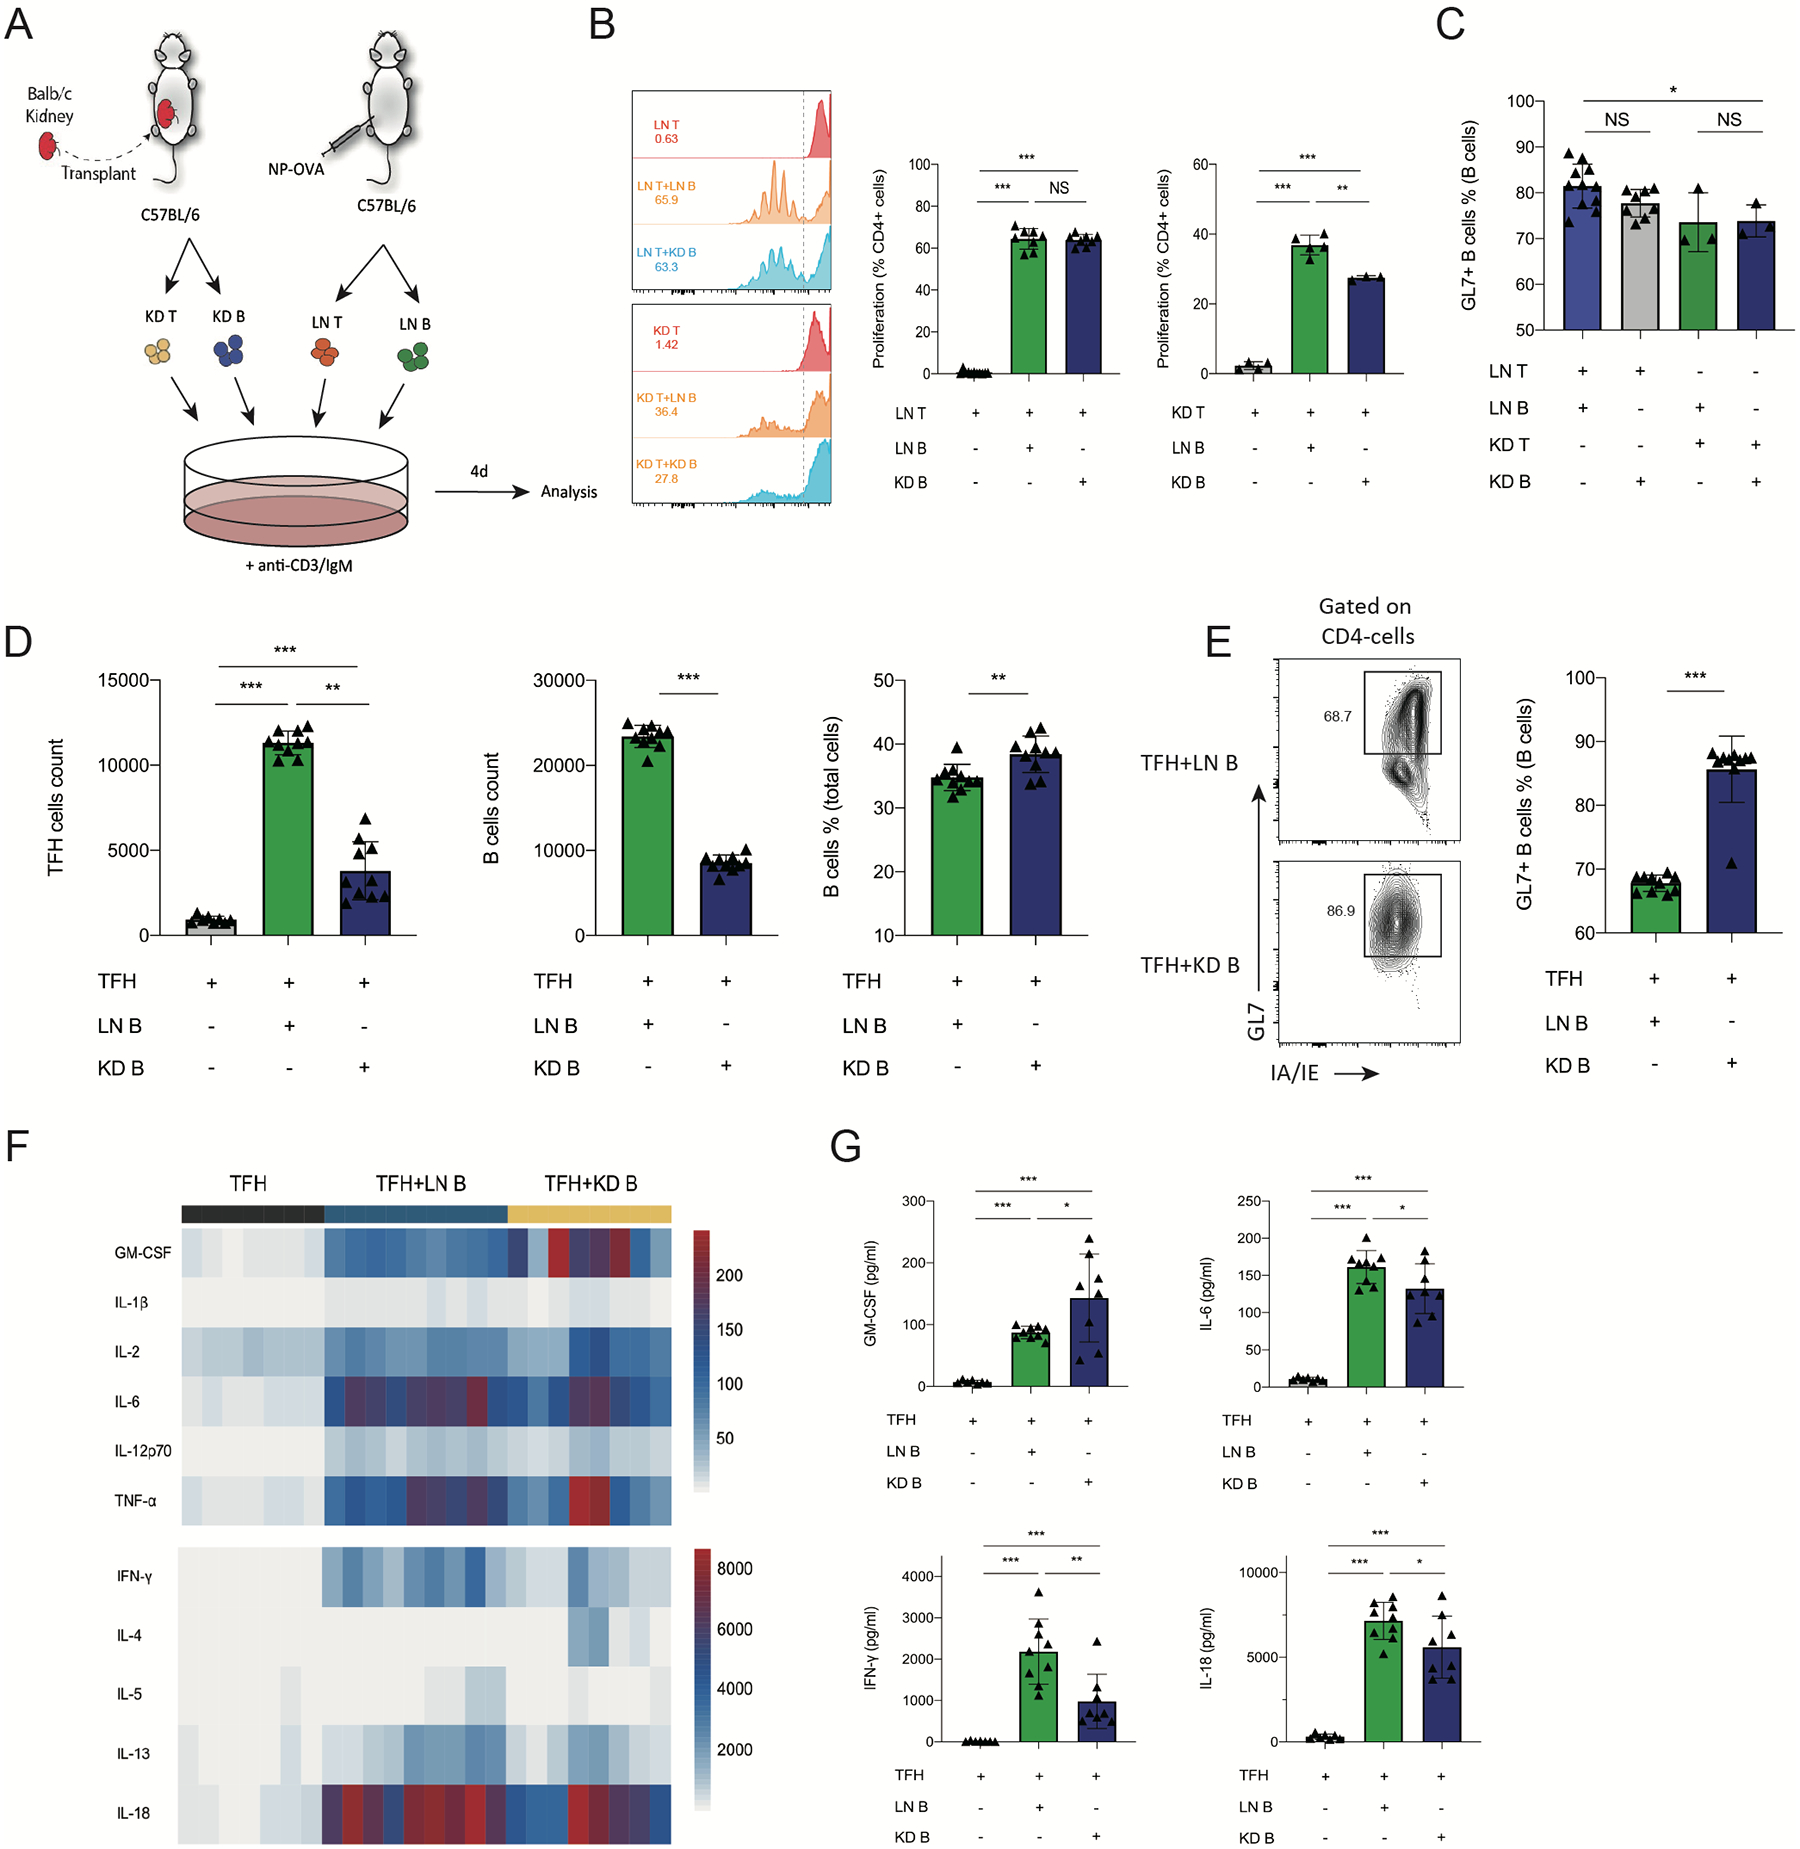
Figure 5. Intrarenal B cells have diminished ability to expand Tfh cells.

(A) Schematic of in vitro T-B cell stimulation assay. CD4+ T cells (LN T) and CD19+ B (LN B) cells from NP-OVA immunized mice were cultured with intrarenal B (KD B) or CD4+T cells for 4 days. (B) Quantification of T cells proliferation. T cells from LNs and grafts were stained with CellTrace Violet, the peaks represent successive generations of cells. The right side of the dashed line represents nonproliferating cells. Percentage of proliferated cells in total T cells were calculated. (C) Quantification of GL7+IA/IE+ B cells. (D) CD4+ICOS+CXCR5+FoxP3–CD19– cells (TFH) and CD19+CD4− B (LN B) cells from NP-OVA immunized mice were cultured with intrarenal B (CD45+CD19+CD4−) cells (KD B) for 6 days. Quantification of Tfh (CD4+IA/IE−) count, B cells (GL7+IA/IE+) percentage and count in the Tfh-B cells stimulation assays. (E) Quantification of GL7+ B cells. Representative plots (left) and quantification (right) are shown. (F) Heatmap of cytokine concentration of supernatant in Tfh-B cells culture by luminex analysis. (G) The concentration of cytokines GM-CSF, IL-6, IFN-γ, IL-18 in the supernatant in co-culture of Tfh and B cells. Data are from a single experiment and are representative of 3 independent repeats. NS: not significant; **: P < 0.05; **: P < 0.01; ***: P < 0.001.
