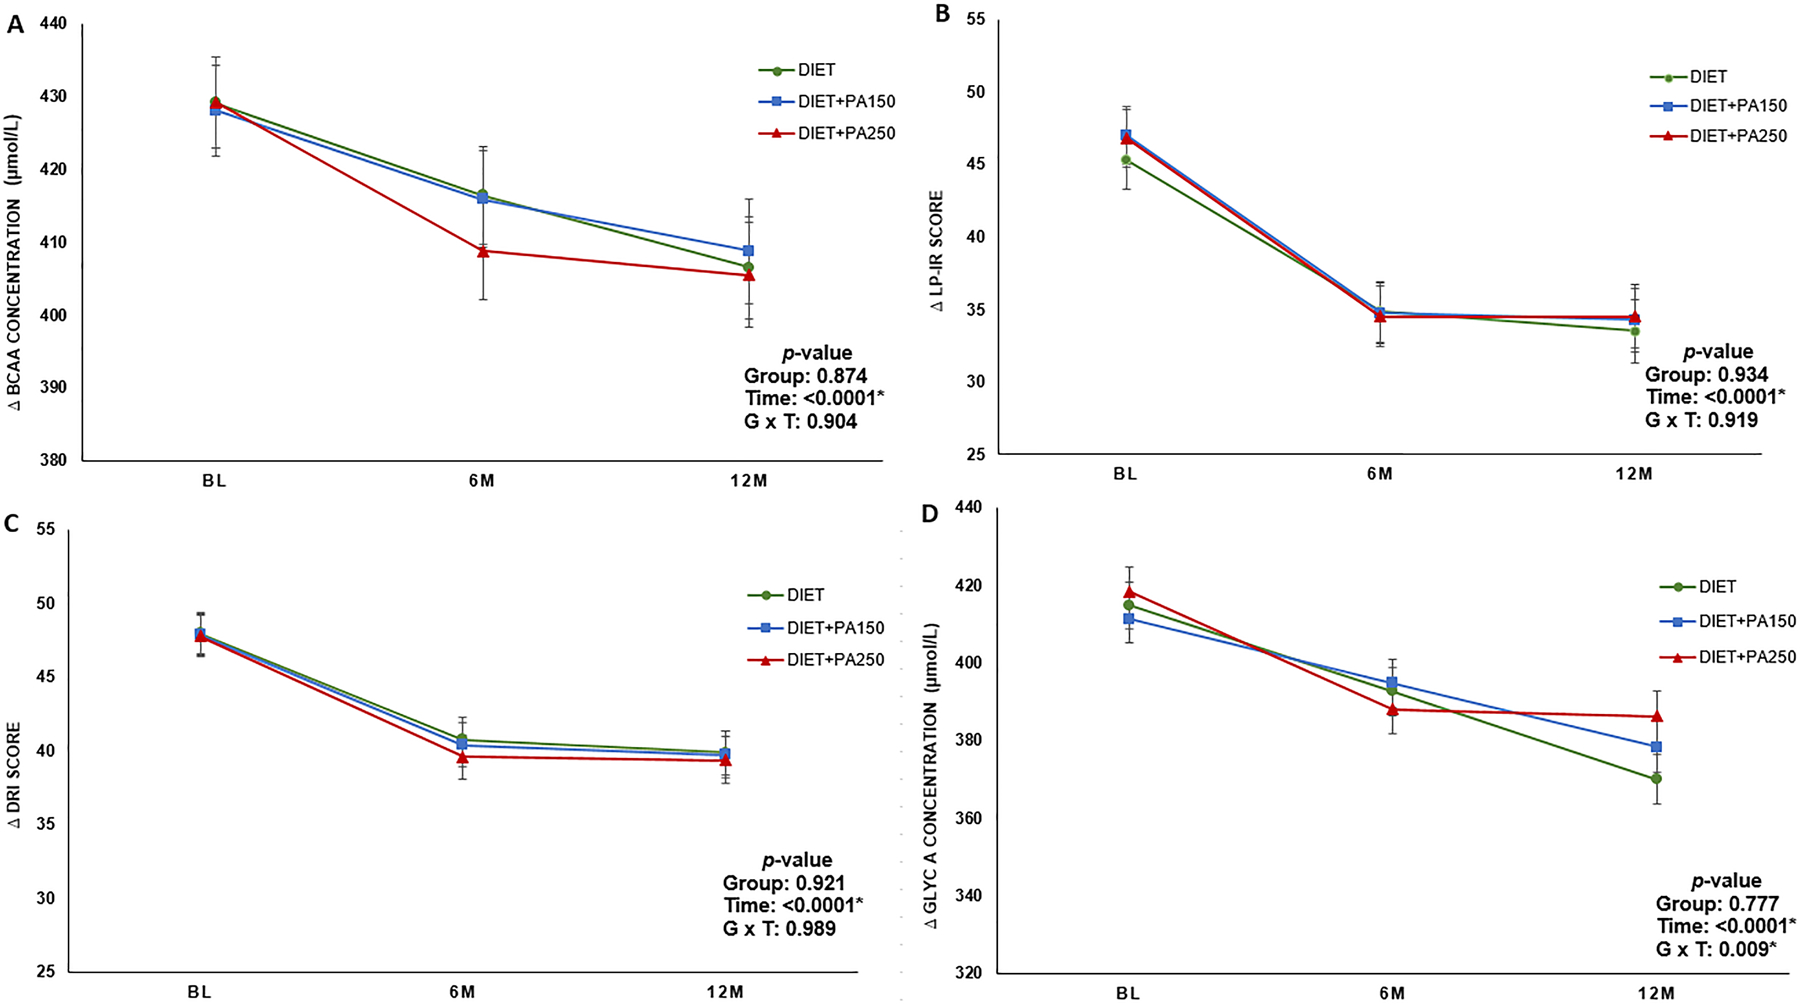
Figure 1.

Least squares mean change in novel insulin resistance and cardiometabolic health biomarkers across randomized intervention group. Error bars represent standard error. p values are displayed in each panel describing the time effect, group effect, and group by time interaction. Panel A: Change in total branched chain amino acid concentration over time; Panel B: Change in Lipoprotein Insulin Resistance Index score over time; Panel C: Change in Diabetes Risk Index over time; Panel D: Change in GlycA concentration over time.
