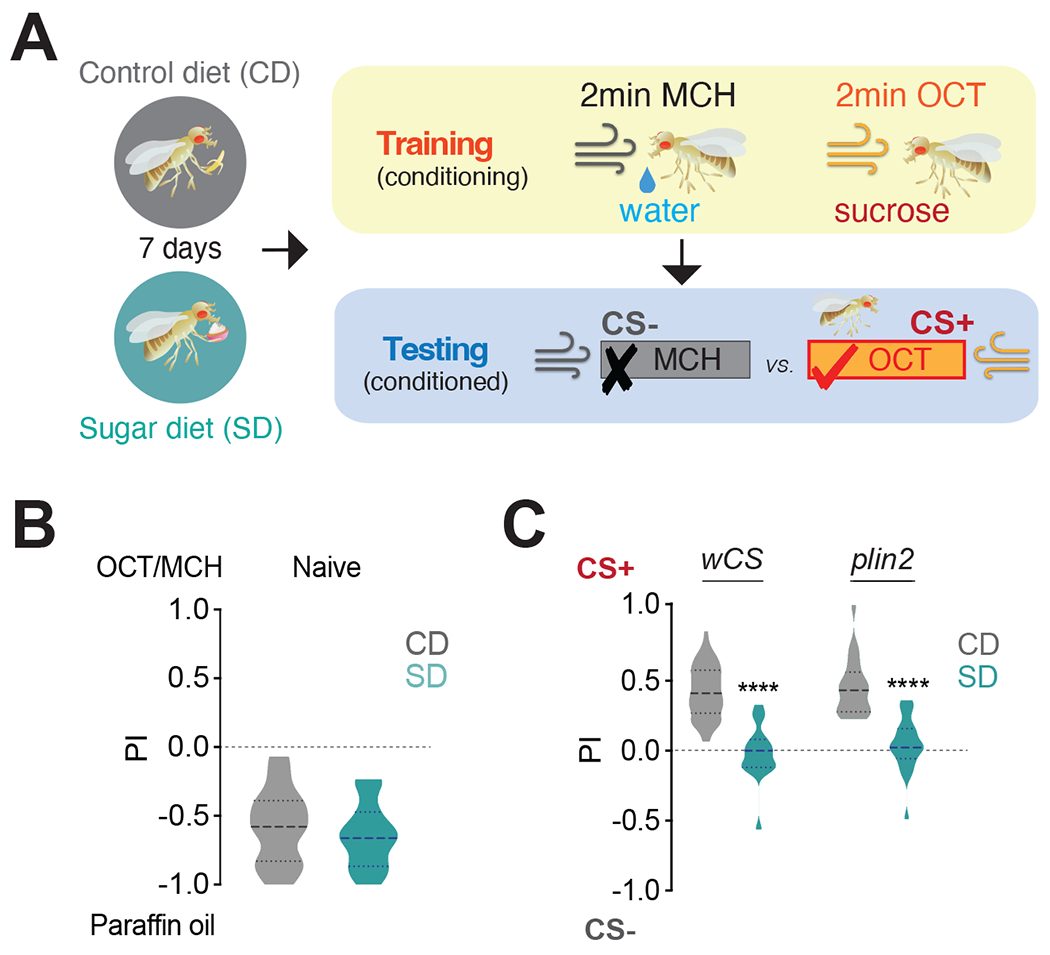
Figure 1: A high sugar diet impairs the formation of food memories independently of fat accumulation.

A) Schematic of appetitive conditioning: flies were fed a Control (CD) or Sugar Diet (SD) for 7 days, trained to pair an odor with either water (CS−) or sucrose (CS+), and then tested for the preference between the CS− or CS+; odors, MCH, 4-methylcyclohexanol and OCT, 3-octanol.
B) Performance index (PI) for naive olfaction between paraffin oil and MCH or OCT in wCS flies fed a CD (gray) or SD (teal). Data consist of a combined set with half of the flies tested with OCT and the other half with MCH. n=24, 1n=25 flies, Mann-Whitney test. The thicker dotted line in the violin plot shows the mean.
C) The PI of control wCS (n=53 CD, n=17 SD) and obesity-resistant plin2 mutant flies (n=22) on CD (gray) and SD (teal). Kruskal-Wallis with Dunn’s multiple comparison test, ****p<0.0001.
See also Figure S1.
