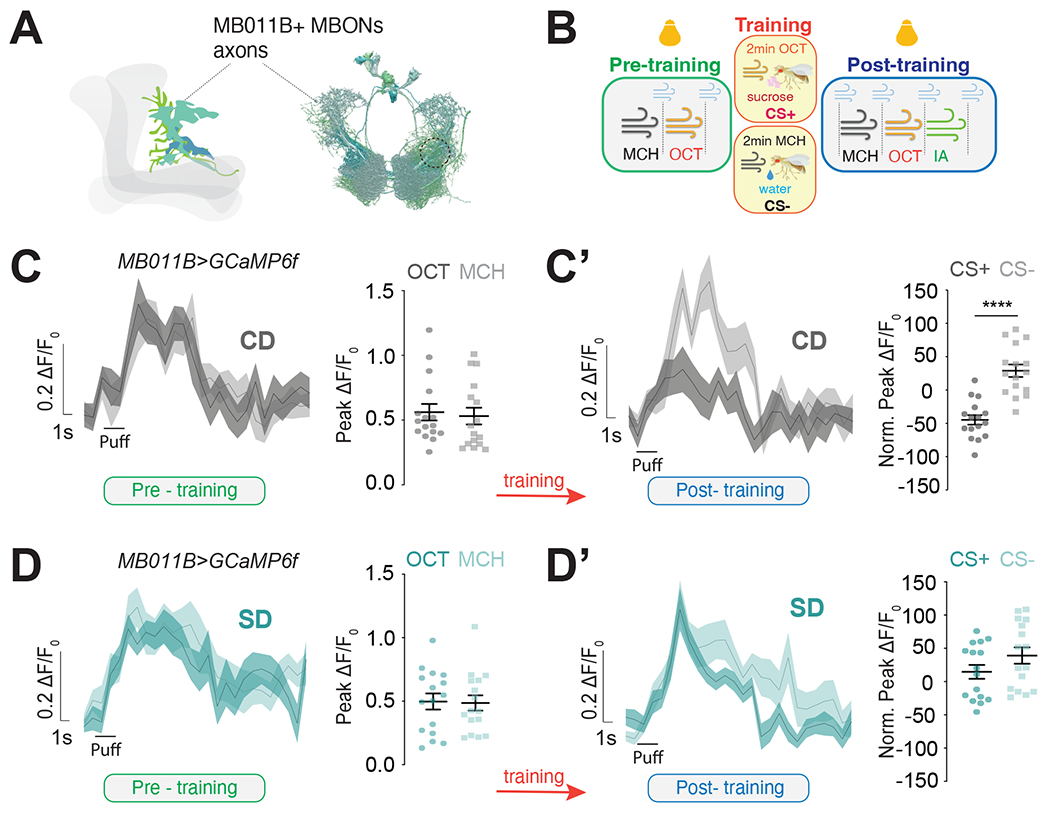
Figure 5: Learning changes the presynaptic responses of the MB011B+ MBONs to cues.

A) Graphic (left) and connectome reconstruction (right) of MB011B+ β’2mp axons; in the graphic only cells in one hemisphere are shown; dotted circle shows the region imaged.
B) Schematic of the appetitive conditioning protocol under the 2-photon microscope in pre-training (naive, green), training (yellow), and post-training (testing, blue) phases; yellow bulbs represent imaging.
C-D) The calcium responses to MCH and OCT (puff) in the β′2mp axons of MB011B>GcAMP6f neurons before (C and D, green) and after (C’ and D’, blue) training (red arrow) in Control Diet, CD (C-C’) and Sugar Diet, SD (D-D’) flies. Data are shown as mean +/− SEM ΔF/F0 traces and quantified as maximum peak ΔF/F0 response (pre-training) or normalized to naive responses (post-training). C-C’) left Mann-Whitney and right student t-test, D-D’) left student t-test and right Mann-Whitney test; ****p<0.0001.
See also Figure S5.
