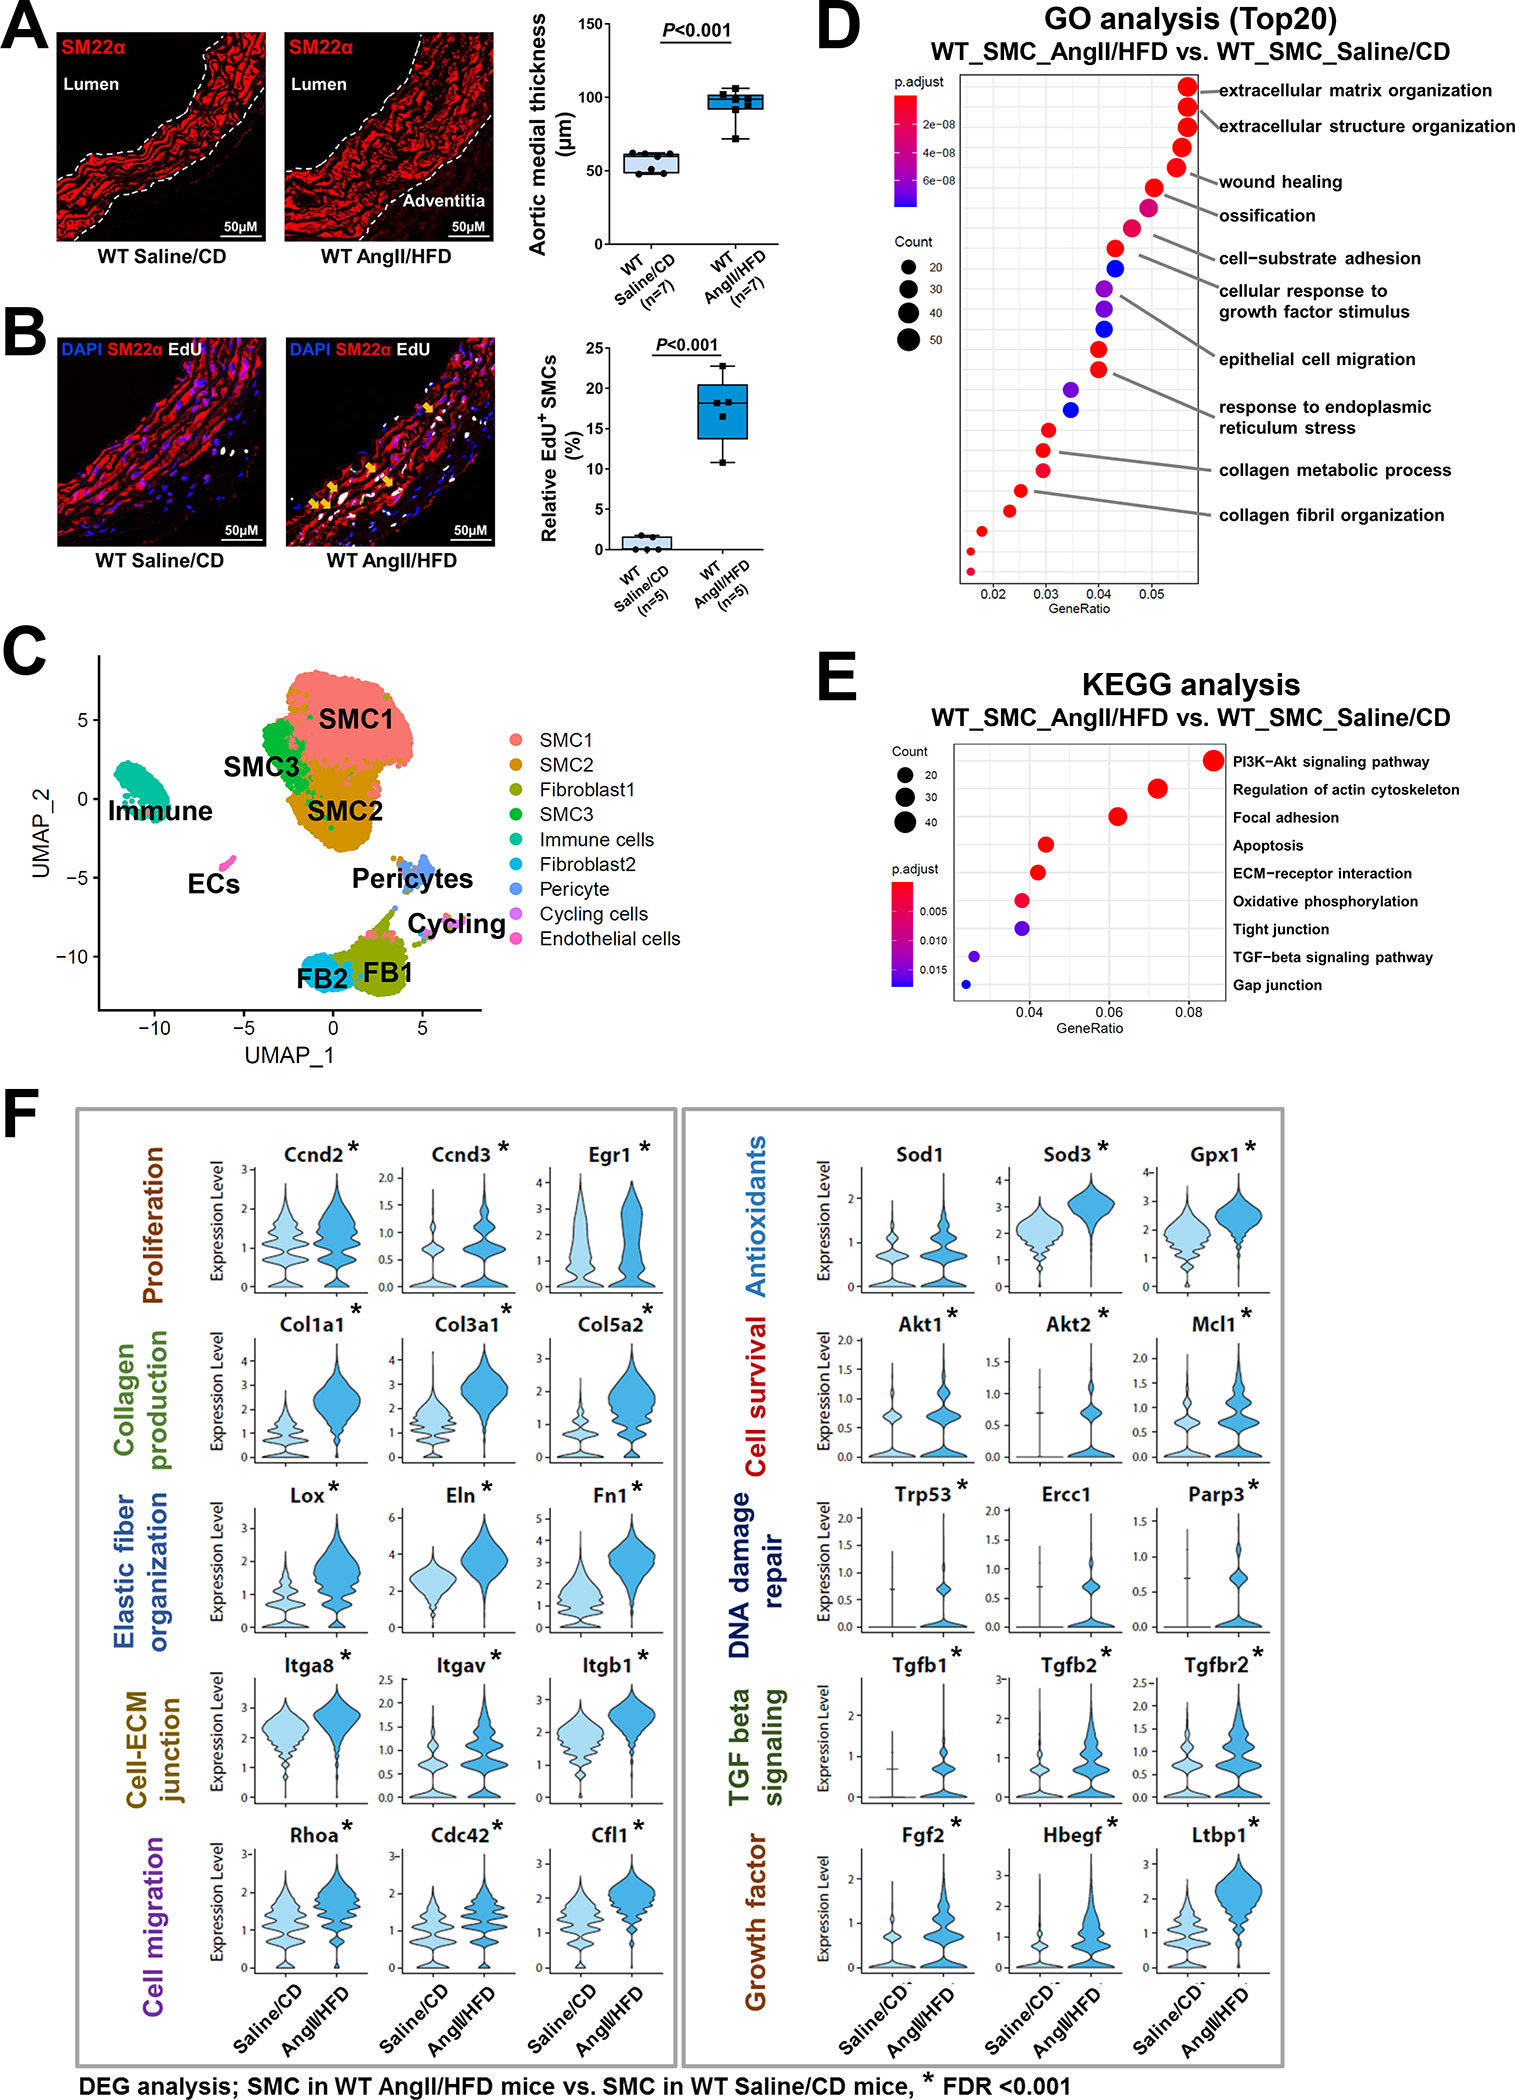
Figure 1. Single-cell RNA sequencing (scRNA-seq) analysis showing a dynamic smooth muscle cell (SMC) adaptive response to angiotensin II infusion and a high-fat diet (AngII/HFD).

A, Representative immunofluorescence staining of SMCs (SM22-α) showing that AngII/HFD increased medial thickness in the aortic wall (M, media) of wild-type (WT) mice. Box and whisker plots showing that the extent of medial thickness was increased in the ascending aorta of AngII/HFD-treated WT mice compared with saline/control diet (CD) (standard rodent diet)-treated mice (n=7 per group). B, Immunostaining showing an increase in EdU-labeled proliferating SMCs (SM22-α+) in the ascending aortic tissue of AngII/HFD-treated WT mice and the depletion of SMCs in aneurysm and dissection (AAD) tissues of AngII/HFD-treated mice. Box and whisker plots showing that the quantity of EdU+ SMCs was increased in the ascending aorta of AngII/HFD-treated WT mice (n=5) compared with saline/CD-treated WT mice (n=5). C, A 2-dimensional uniform manifold approximation and projection (UMAP) plot showing all cells colored according to the 9 major cell clusters. D-E, Dot plots showing gene ontology (GO) enrichment terms (top 20) and Kyoto Encyclopedia of Genes and Genomes (KEGG) pathway enrichment of differentially expressed genes (DEGs) induced by AngII infusion in all SMCs. F, Violin plots showing the mRNA abundance of select adaptive response genes in all SMCs. *FDR (false discovery rate) <0.001, SMCs in AngII/HFD-treated WT mice vs. SMCs in saline/CD-treated WT mice in scRNA-seq. An unpaired Student’s t-test was used in (A) and (B). P<0.001. Data are shown as box and whisker plots with the first quartile, minimum, median, third quartile, and maximum.
