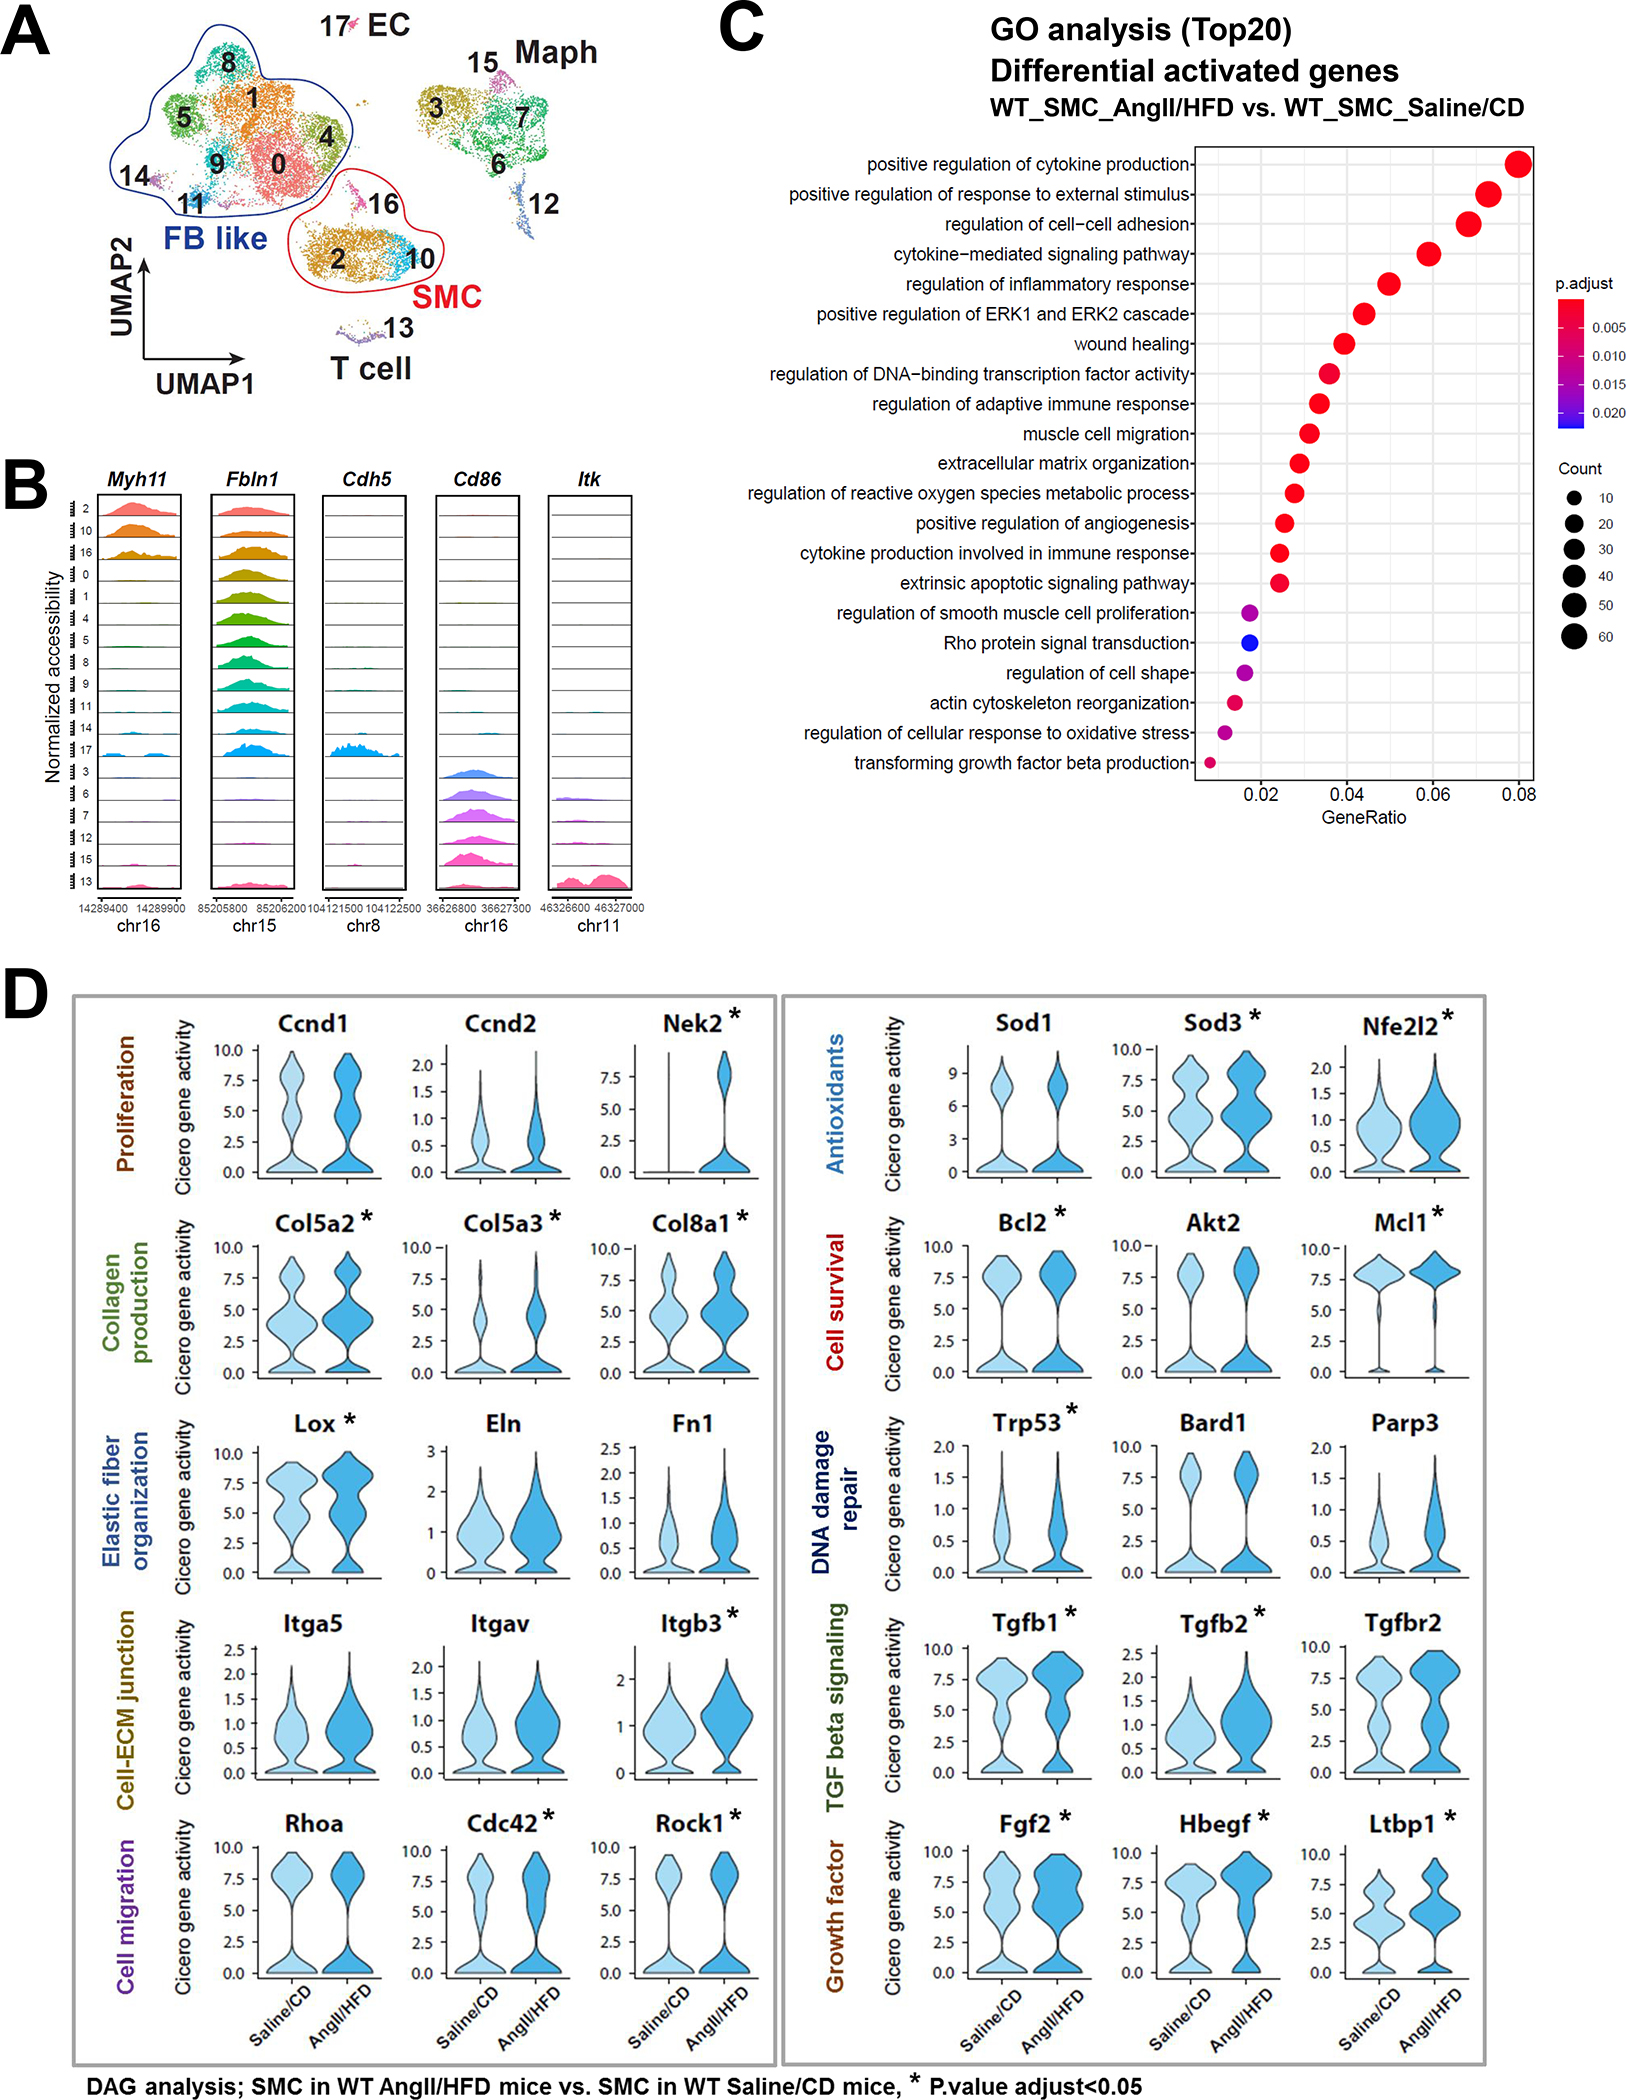
Figure 2. Single-cell sequencing assay for transposase-accessible chromatin (scATAC-seq) analysis showing that aortic stress triggers chromatin accessibility dynamics of smooth muscle cells (SMCs).

A, Ascending aortas of AngII/HFD-treated mice (i.e., infused with AngII for 7 days) and of saline/CD-treated mice (n=3 per group) were used for single live-cell isolation, single nuclei preparation, and scATAC-seq analysis. ScATAC-seq data projected on a 2-dimensional uniform manifold approximation and projection (UMAP). Cells are colored by cluster. Maph: macrophage, FB: fibroblast, EC: endothelial cell. B, Genome browser views (IGV) of cell-cluster combined scATAC-seq cell type marker peaks. Each row is a cluster (left), and each column is a locus within 50 kb of an ATAC-seq cell type marker gene. The colored peaks represent the normalized read count coverage. C, Dot plot showing the gene ontology (GO) enrichment terms of genes activated by AngII infusion. D, Violin plots showing the Cicero gene activity of select adaptive response genes in all SMCs. *Adjusted P-value <0.05, SMCs in AngII/HFD-treated mice vs. SMCs in saline/CD-treated mice in scATAC-seq.
