
Figure 6. The YAP-mediated adaptive response identified by performing single-cell transcriptomic analysis of smooth muscle cell (SMC)-specific Yap knockout mouse aortas.
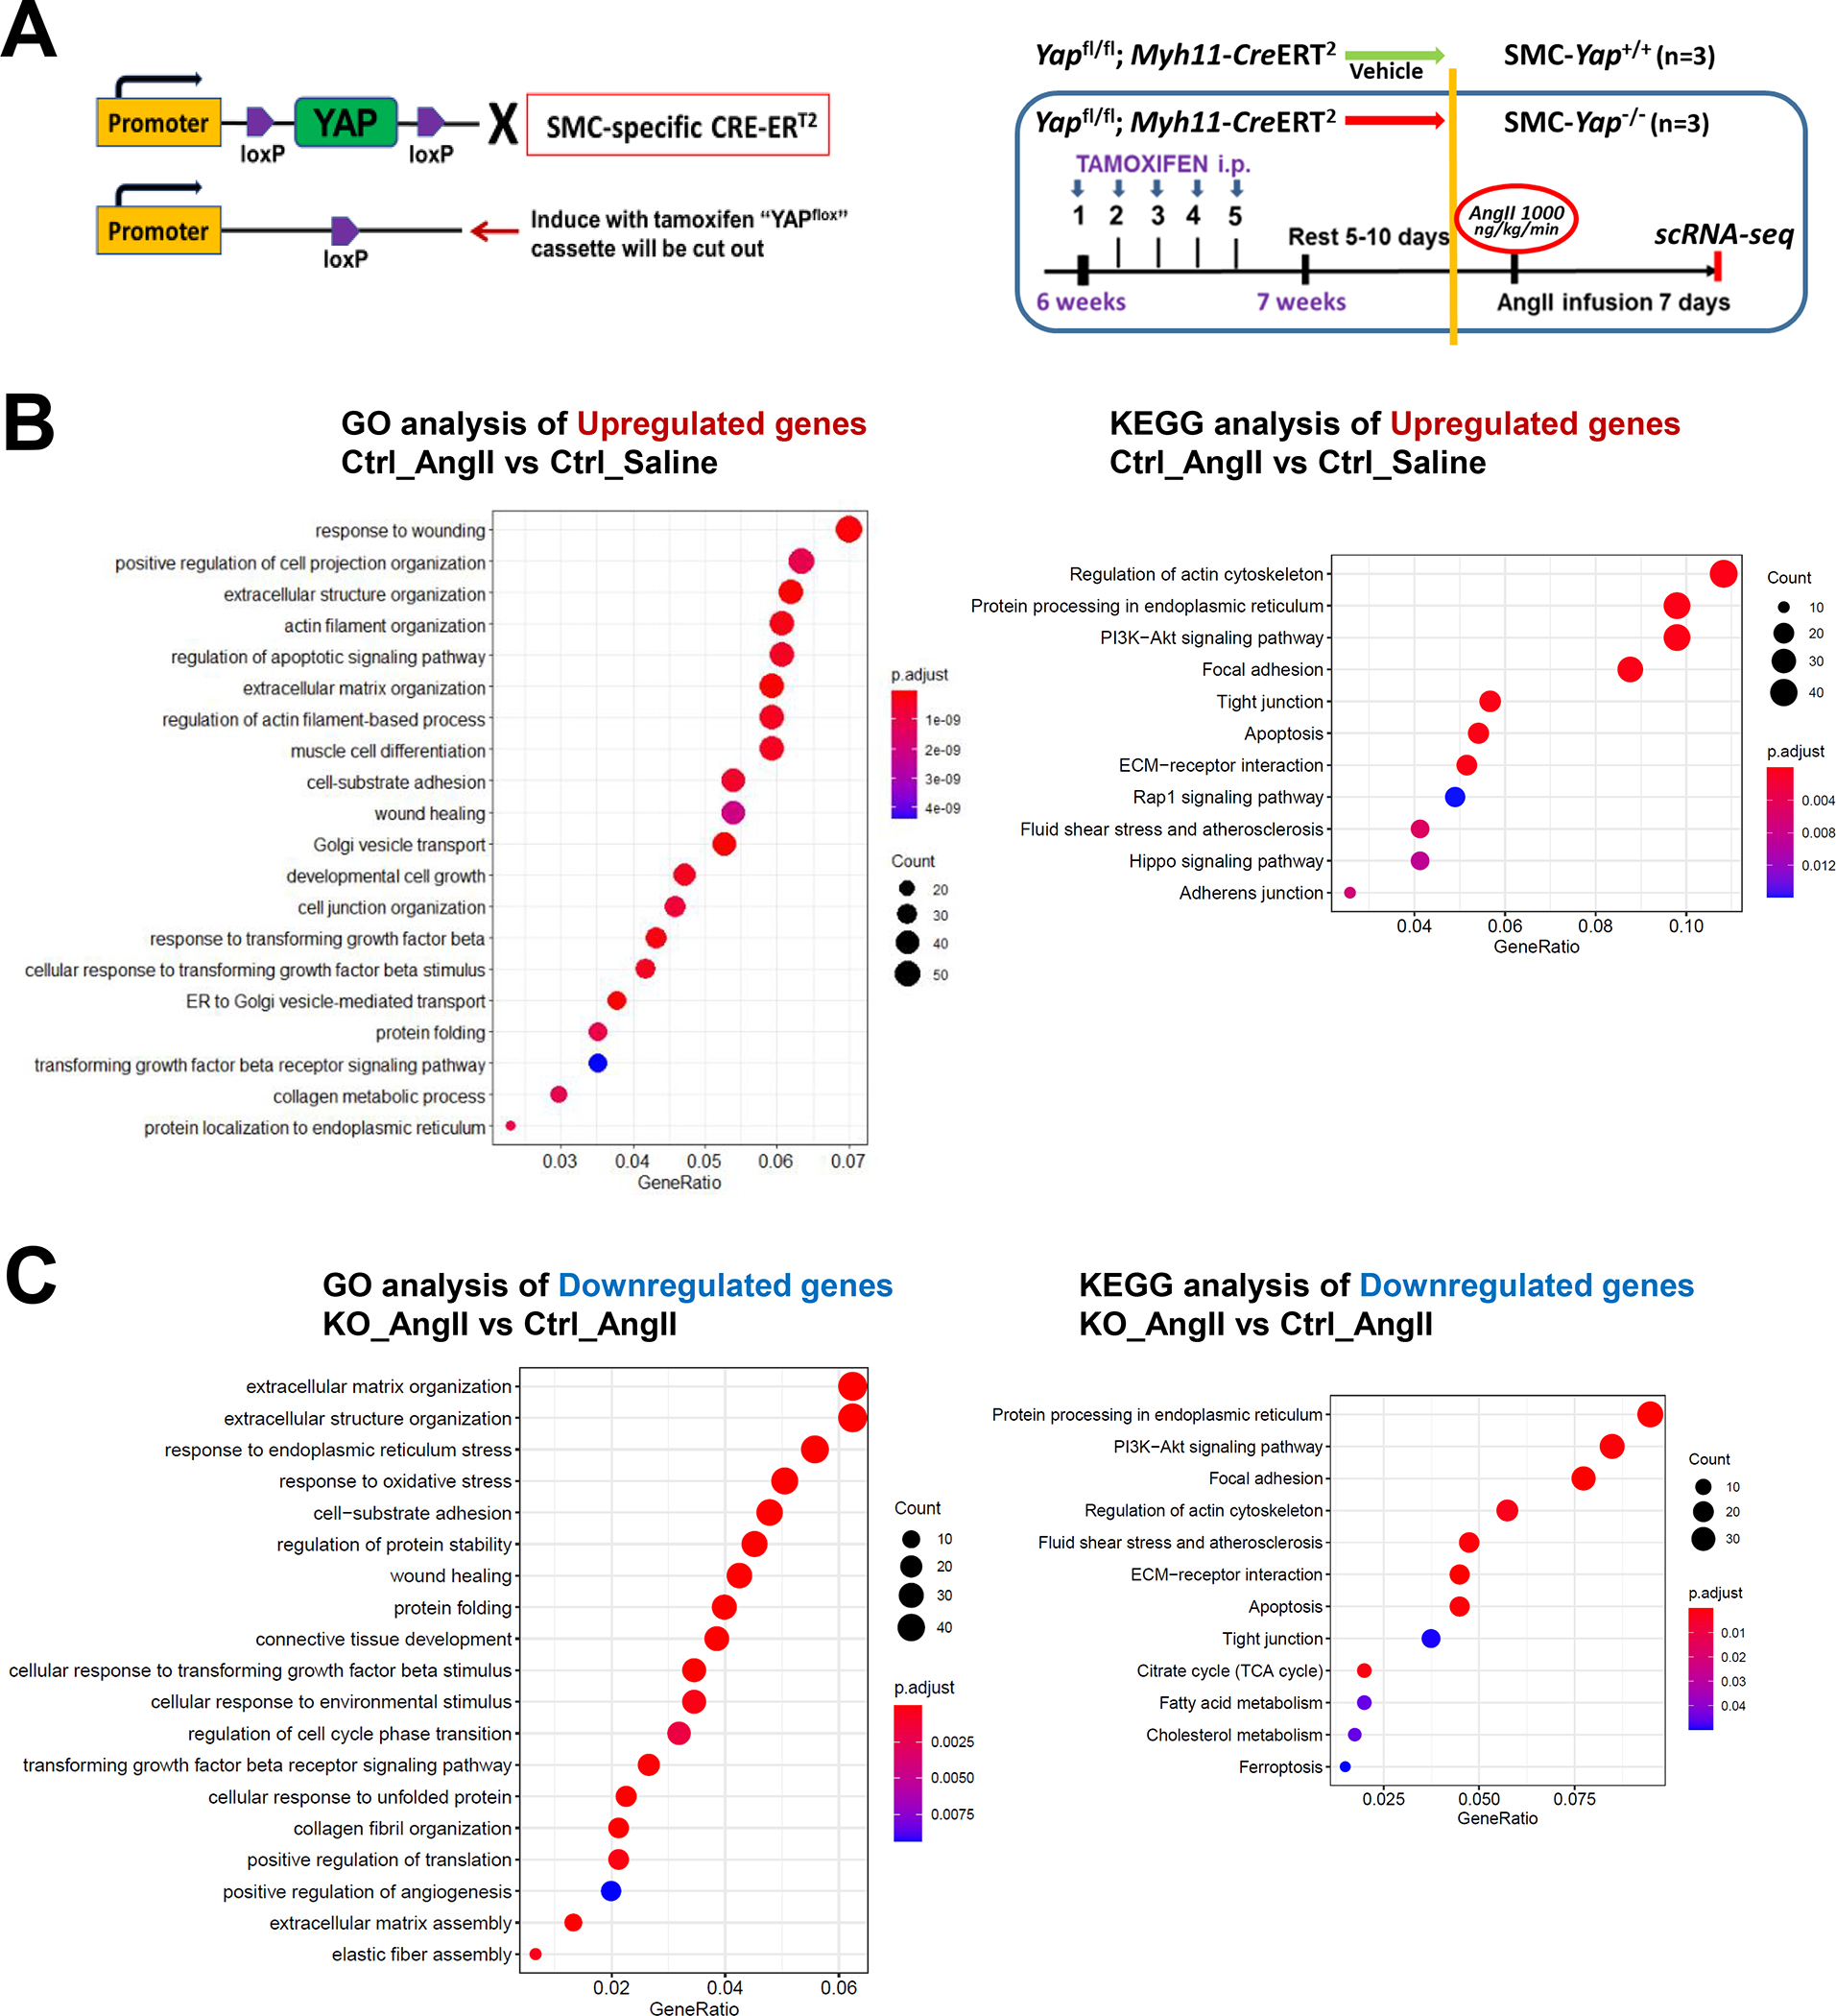
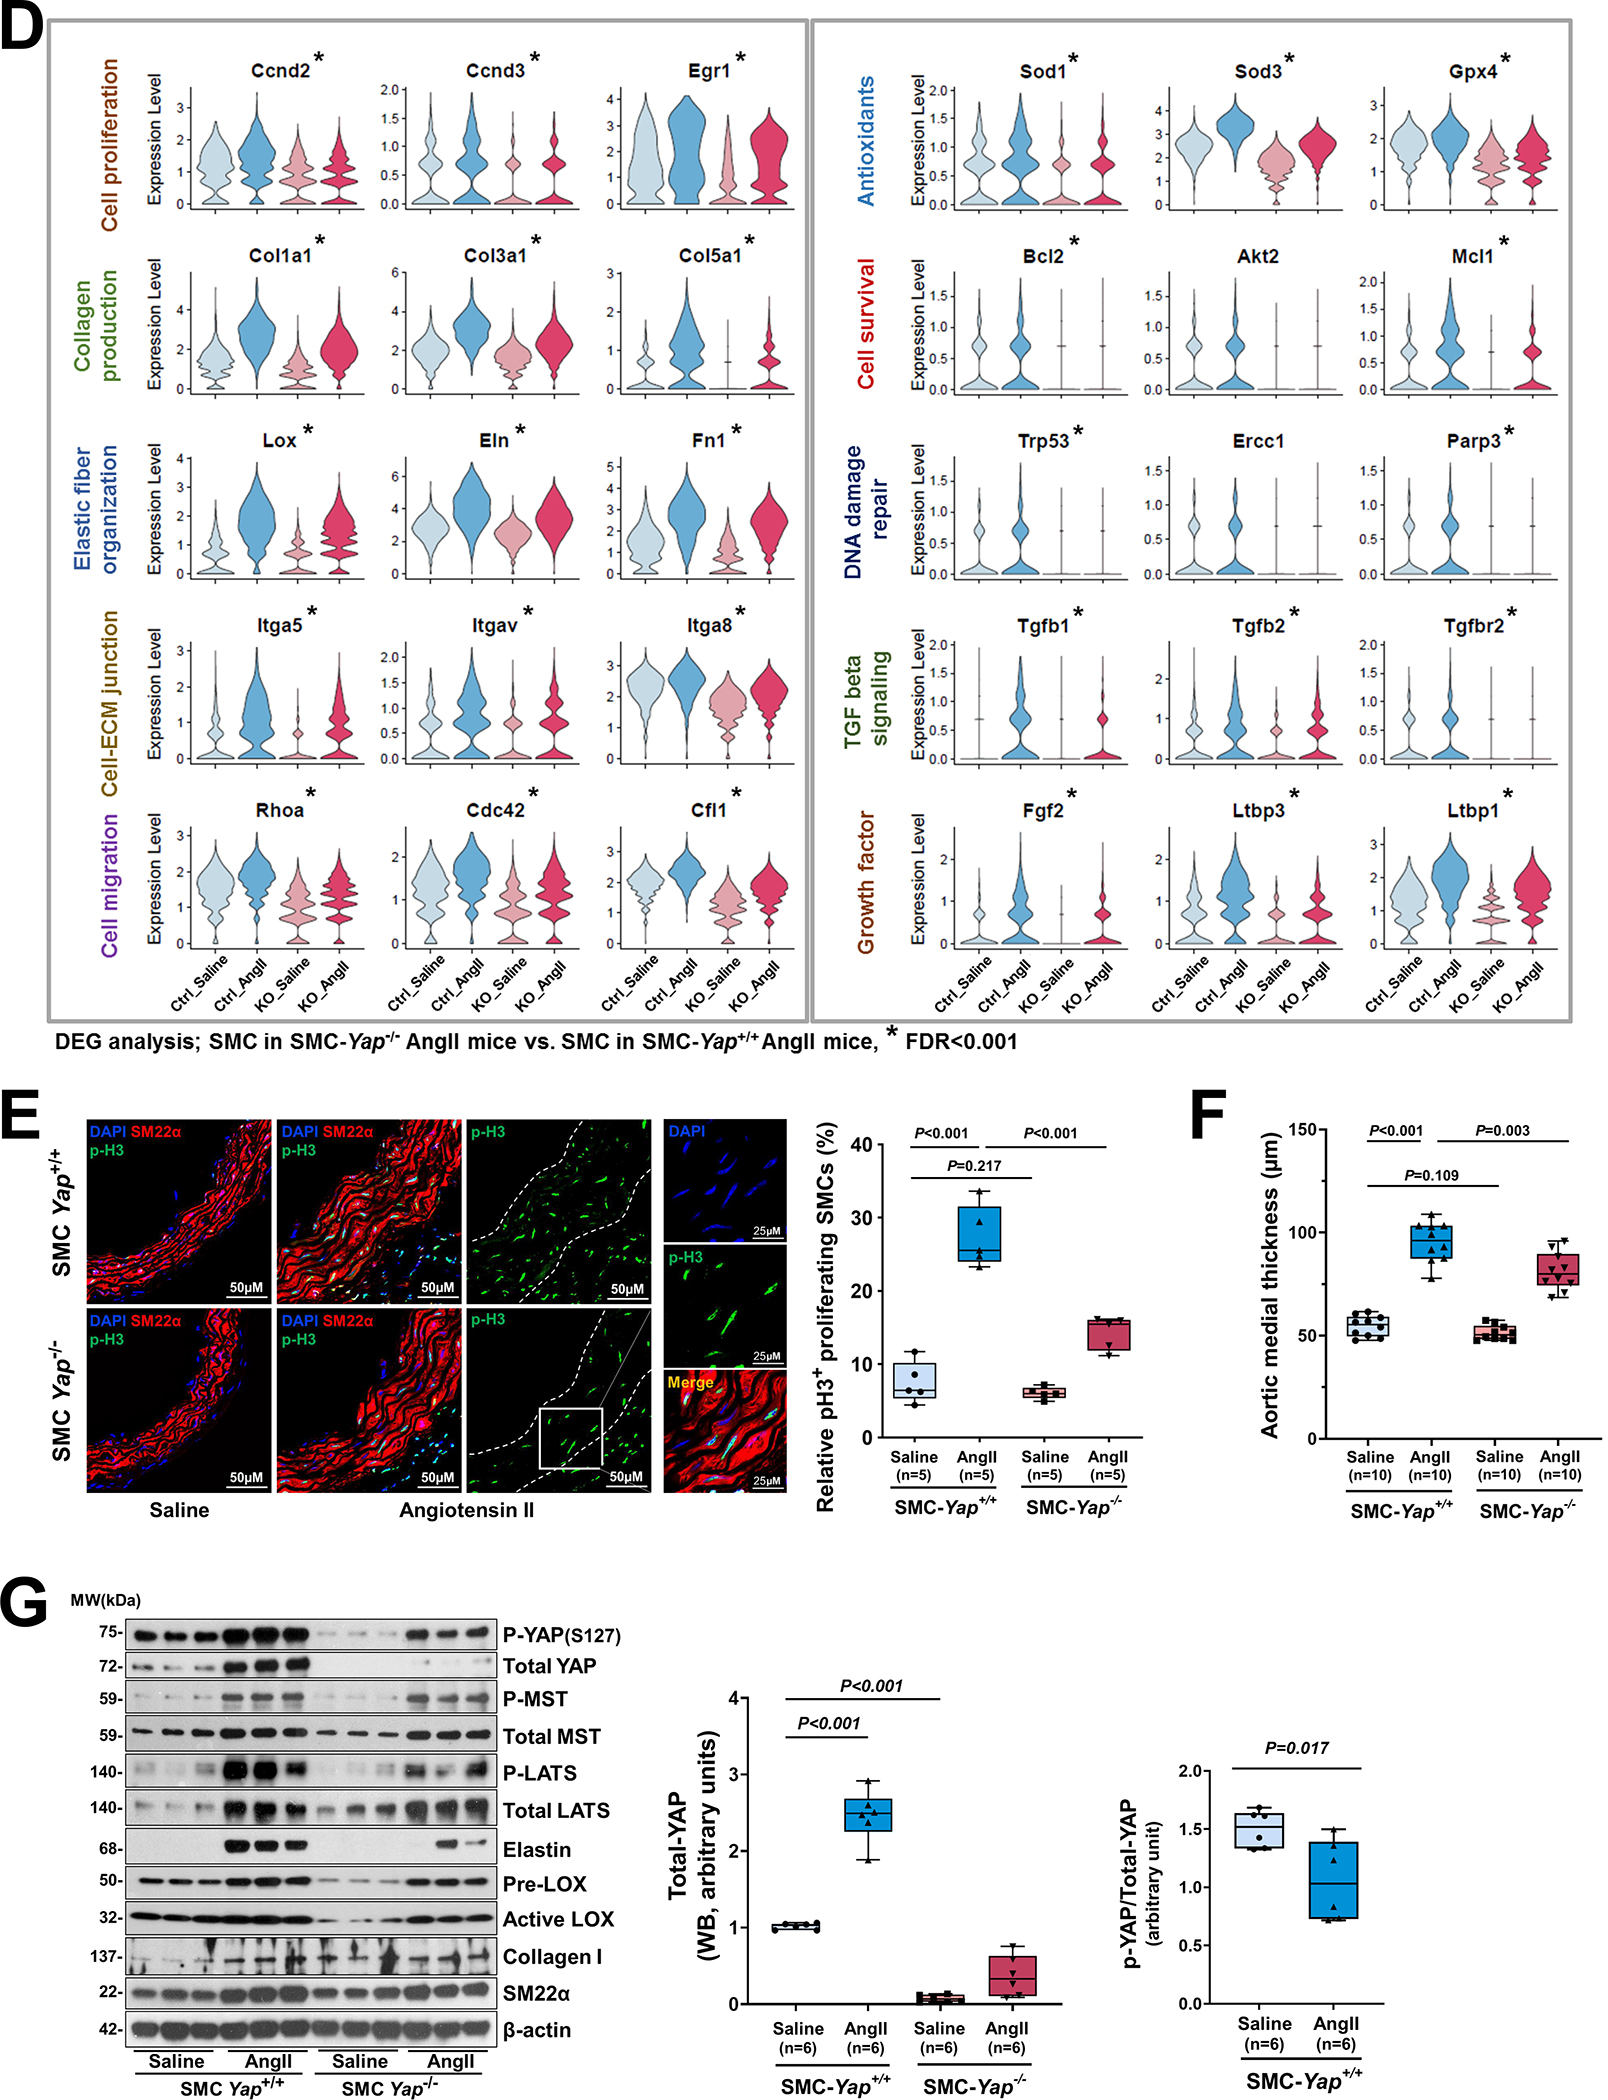
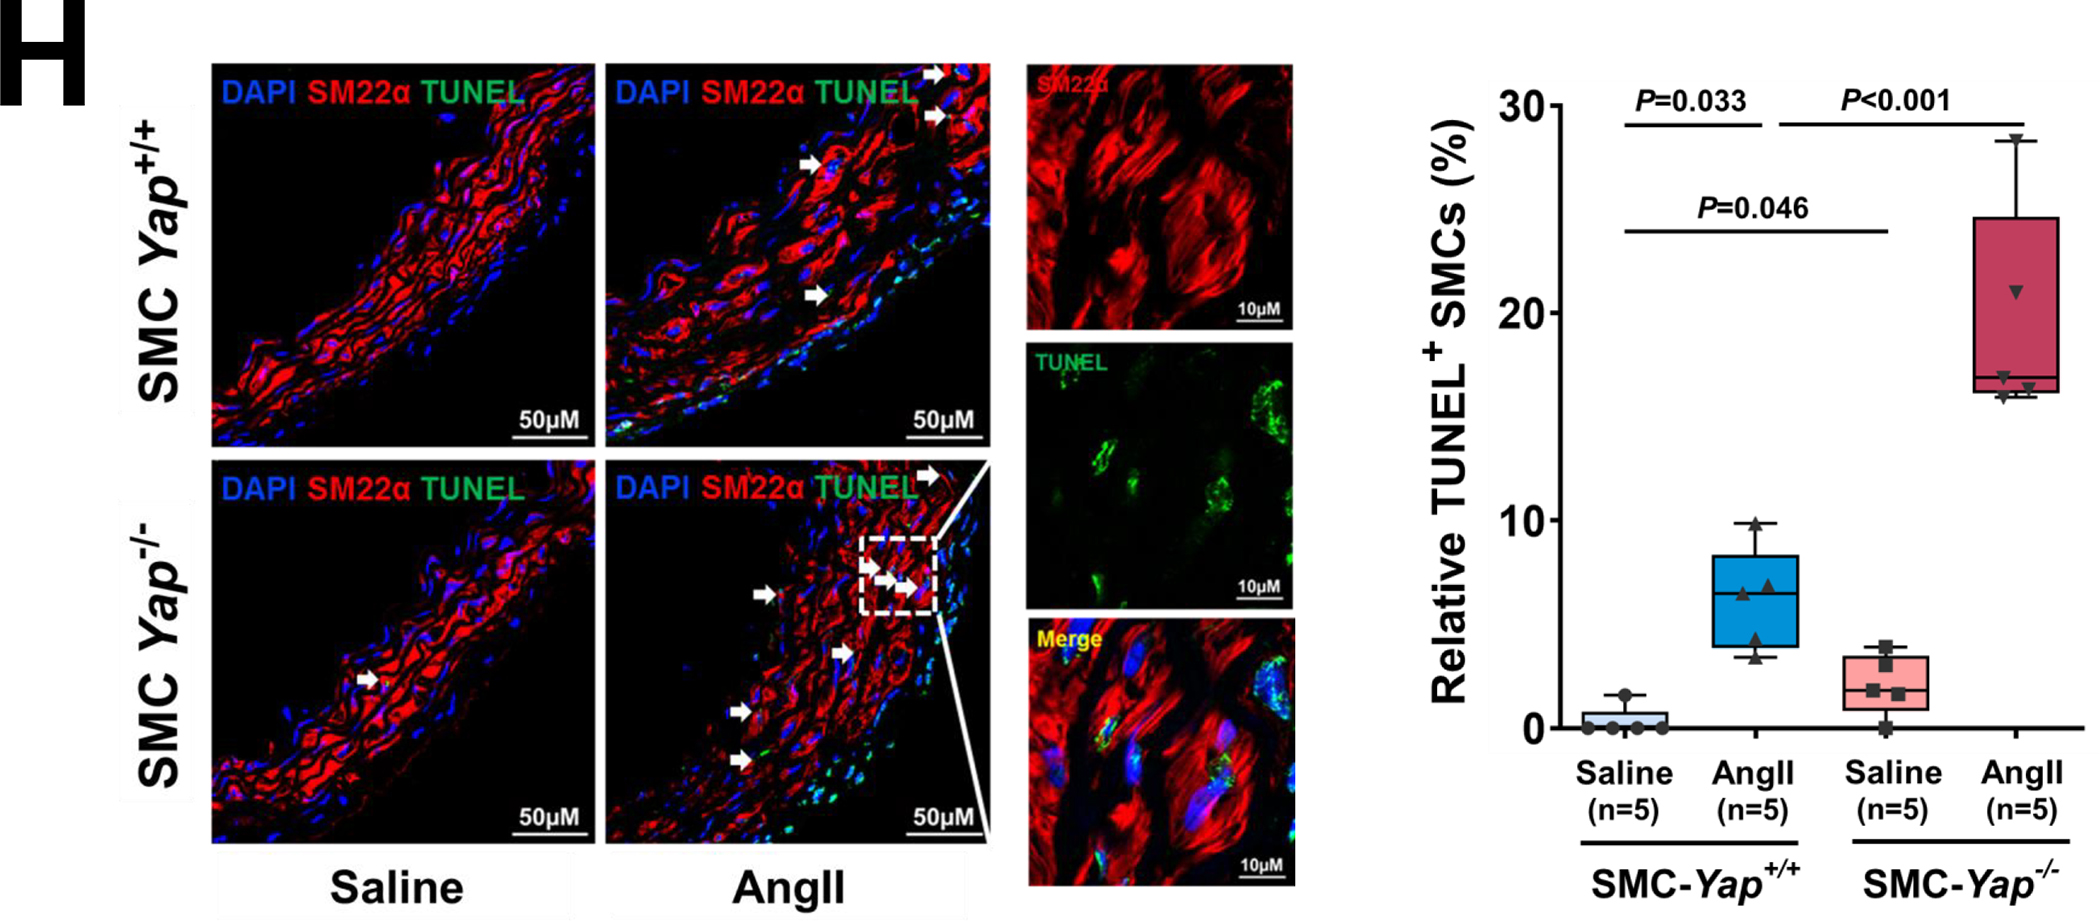
A, Six-week-old male Yap1fl/fl; Myh11-CreERT2 mice were given tamoxifen or vehicle (corn oil) via daily intraperitoneal injection for 5 days. Seven days later, mice were infused with angiotensin II (AngII 1,000 ng/kg/min; n=3) or saline (n=3; control) for 7 days, and ascending aortas were collected for single-cell RNA-seq. B, Dot plot of the top 20 enriched gene ontology (GO) biologic process terms and top-enriched Kyoto Encyclopedia of Genes and Genomes (KEGG) pathway terms identified in SMCs of AngII-infused SMC-Yap+/+ mice (Ctrl_AngII) compared with SMCs of saline-infused SMC-Yap+/+ mice (Ctrl_Saline). Associated genes were significantly upregulated in SMC-Yap+/+ AngII mice (logFC< −0.3 & FDR<0.05). The size of the dots represents the number of genes that are on the list of significant differentially expressed genes associated with GO and KEGG terms. The color of the dots represents the P-adjusted values. C, Dot plot of the top GO biologic process terms and KEGG pathway terms identified in SMCs of AngII-infused SMC-Yap−/− mice (KO_AngII) compared with SMCs of AngII-infused SMC-Yap+/+ mice (Ctrl_AngII) showing the significant downregulation of the associated genes in SMC-Yap−/− AngII-infused mice (logFC< −0.3 & FDR<0.05). D, Violin plots showing the mRNA abundance changes of adaptive response genes in all Myh11+ SMCs of 4 groups of mice (Ctrl_Saline, Ctrl_AngII, KO_Saline, and KO_ AngII). *FDR <0.001, SMCs in SMC-Yap−/− AngII-treated mice vs. SMCs in SMC-Yap+/+ AngII-treated mice in scRNAseq. E, Immunofluorescence staining and quantification of the cell proliferation marker phospho-histone H3 indicated that less SMC proliferation occurred in the ascending aortic medial wall of SMC-Yap−/− AngII-treated mice than in that of SMC-Yap+/+ AngII-treated mice. F, Box and whisker plots showing that medial thickness was reduced in the ascending aorta of AngII-treated SMC-Yap−/− mice compared with AngII-treated SMC-Yap+/+ mice (n=10 per group). G, Western blot analysis of ascending aorta lysates showing that levels of ECM proteins elastin, collagen I, and LOX were markedly lower in AngII-treated SMC-Yap−/− mice than in AngII-treated SMC-Yap+/+ mice. Box and whisker plots showing the quantification of the fold change in total-Yap and the quantification of the p-YAP/total-Yap ratio in Ctrl_Saline and Ctrl_AngII. H, Representative images and corresponding quantification of TUNEL (terminal deoxynucleotidyl transferase dUTP nick end labeling) staining showing a significant increase in the number of TUNEL-positive cells in the ascending aortas of AngII-treated SMC-Yap−/− mice compared with AngII-treated SMC-Yap+/+ mice. Nuclei were counterstained with DAPI (blue). Two-way analysis of variance with the Bonferroni post hoc test was used for pairwise comparisons in (E), (F), (G), and (H). Data are shown as box and whisker plots with the first quartile, minimum, median, third quartile, and maximum.