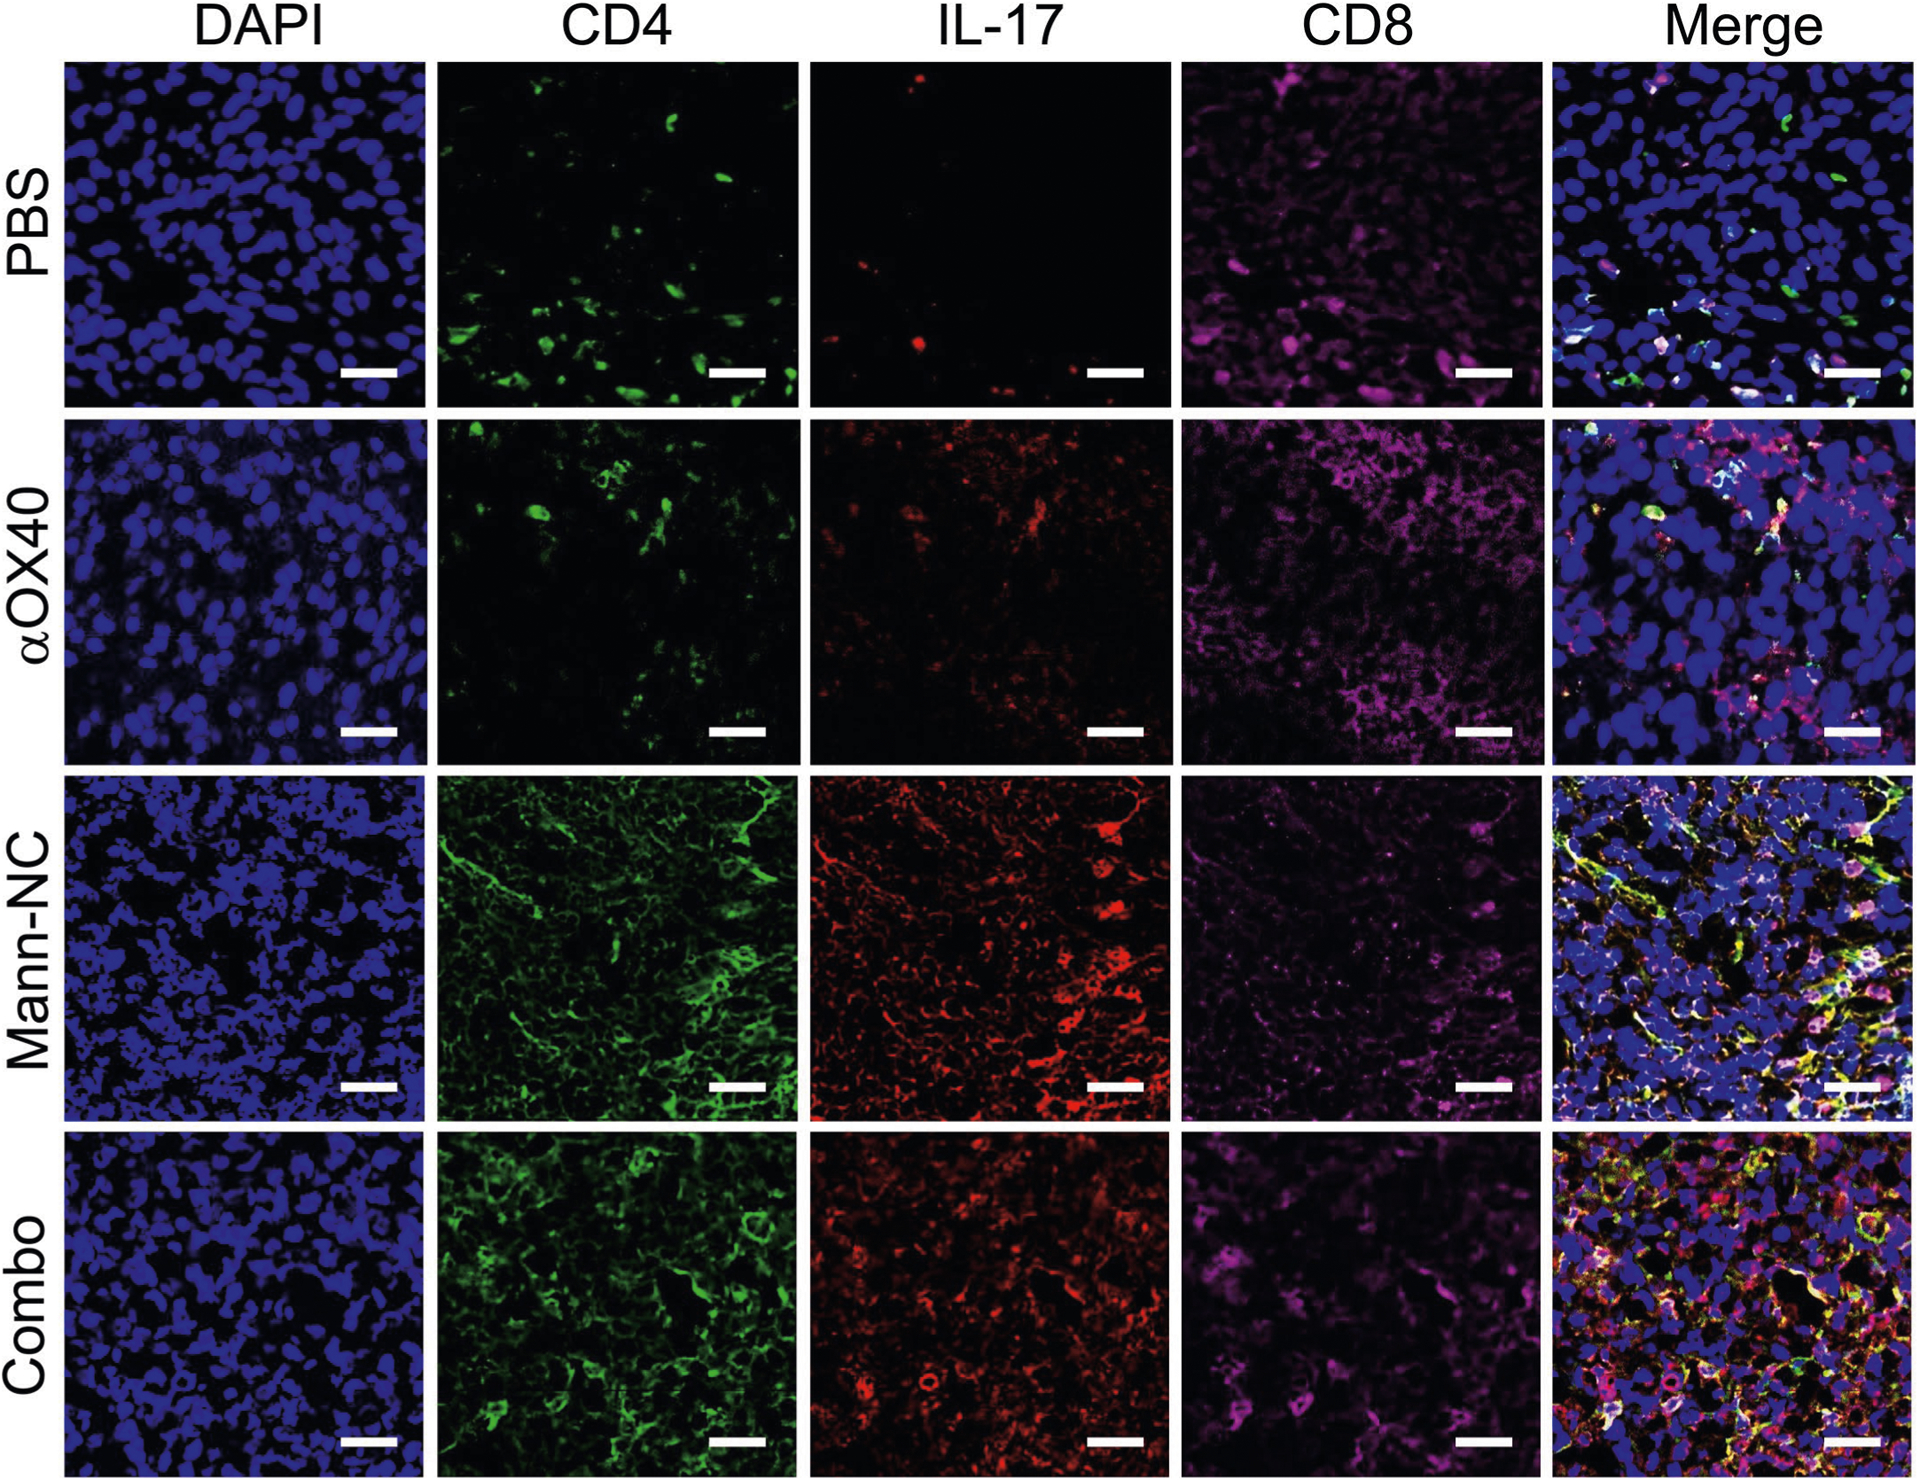
Extended Data Fig. 6 |. Immunofluorescence analysis of IL-17A expression.

Immunofluorescence images of IL-17A expression among CD4 T-cells and CD8 T-cells in TME on day 15. Scale bar represents 50 μm.

Immunofluorescence images of IL-17A expression among CD4 T-cells and CD8 T-cells in TME on day 15. Scale bar represents 50 μm.