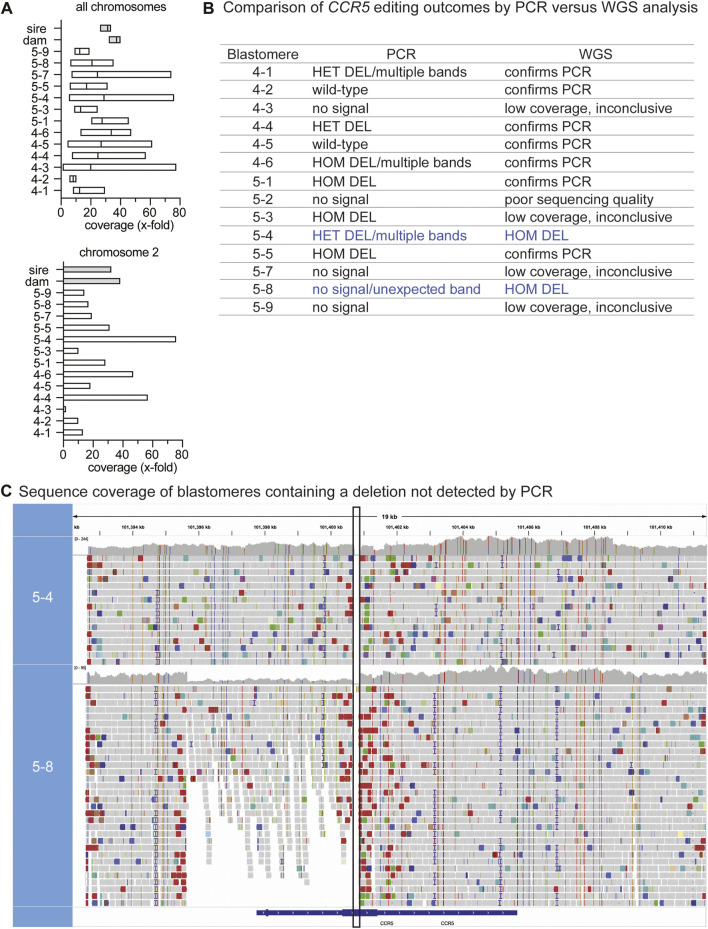
FIGURE 2.
WGS identification of genotypes not identified by PCR-based methods (A). The mean and range in sequencing coverage depth (x-fold coverage) are plotted for each blastomere and parental DNA. The mean and range for all chromosomes is shown in the upper graph and the lower graph shows chromosome 2; CCR5 resides on chromosome 2 (B). Comparison of CCR5 editing outcomes by PCR versus WGS analysis. Blue text indicates cells where WGS identified deletions not previously identified by PCR. HET: heterozygous, HOM: homozygous (C). Sequence coverage at the CCR5 targeting region in blastomeres 5-4 and 5-8 where homozygous/biallelic edits were observed by WGS. The WGS viewer software indicates potential deletions with red bars and in the alignment tracks of 5-8, these are present around the target region and were minimal to absent in the parental coverage map. The vertical black box indicates the expected deleted region between the gRNA target sites.

