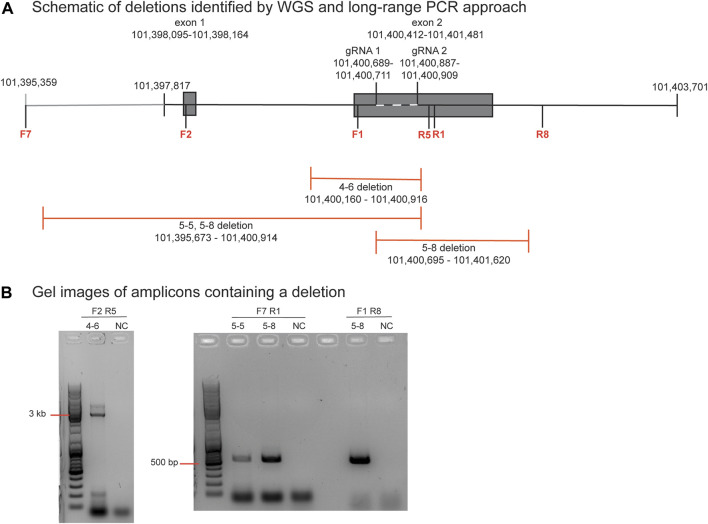
FIGURE 3.
Identification and verification of a large-scale deletion identified by WGS in blastomere 4-6 (A). Schematic diagram of deletions identified by WGS in blastomeres 4-6, 5-5, and 5-8, and the positions of the primers to evaluate the ∼756 bp deletion in blastomere 4-6. Primers are denoted as F or R and their sequences are listed in Supplementary Table S1 (B). Gel electrophoresis image of the PCR amplicons generated by primers that flank each deletion. A no template negative control (NC) reaction was also included.

