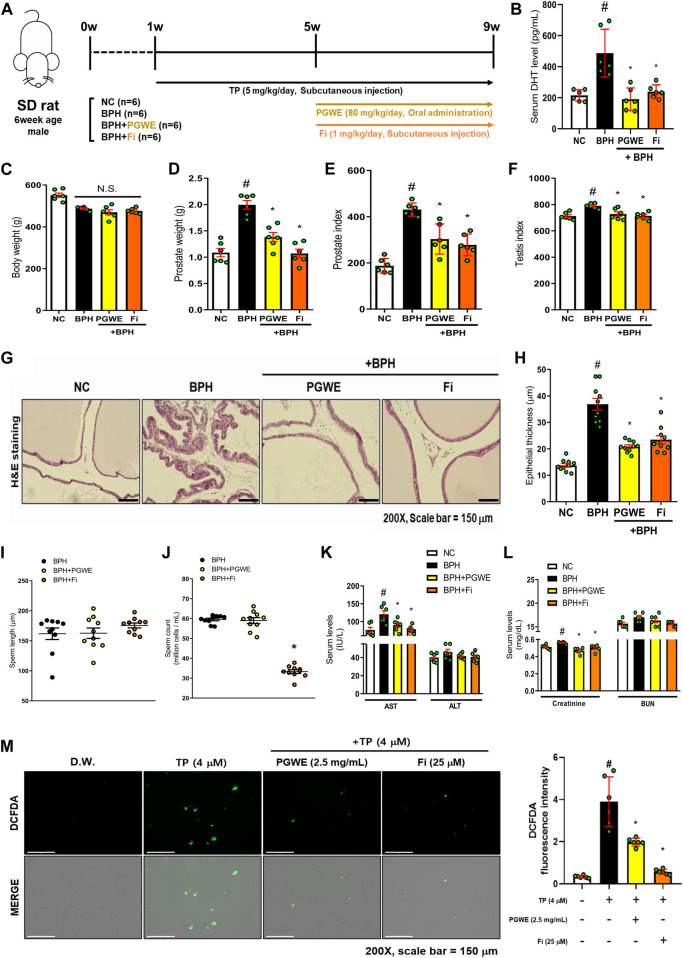
FIGURE 2.
PGWE alleviates pathological signs of BPH in TP-induced BPH rats (A) Experimental scheme of in vivo study (B) Serum DHT levels were analyzed using ELISA kits (C) Body and (D) prostate weights were assessed (E) Prostate index was calculated by prostate weight (mg)/body weight (100 g) (F) Testis index was calculated by testis weight (mg)/body weight (100 g) (G) H and E staining analysis was performed using prostate tissues of TP-induced BPH rats (magnification × 200, scale bar 150 µm) (H) Based on H and E staining, the epithelial thickness was measured using ImageJ software (J) Number of sperm extracted from the epididymis of rats and (I) length of sperm were calculated using ImageJ software (K, L) Serum levels of AST, ALT, creatinine, and BUN were measured (M) ROS levels were detected by fluorescence microscopy after DCFDA staining in TP-treated RWPE-1 cells. All data are expressed as mean ± SEM of independent experiments. Statistical differences were calculated by one-way ANOVA with post-hoc Tukey’s test. # p < 0.05 vs NC groups or D.W.-treated RWPE-1 cells; ∗ p < 0.05 vs BPH group or TP-treated RWPE-1 cells. NC, normal control; BPH, benign prostatic hyperplasia; TP, testosterone propionate; PGWE, Panax ginseng C. A. Meyer water extract; Fi, finasteride; D.W., distilled water.

