Figure 2.
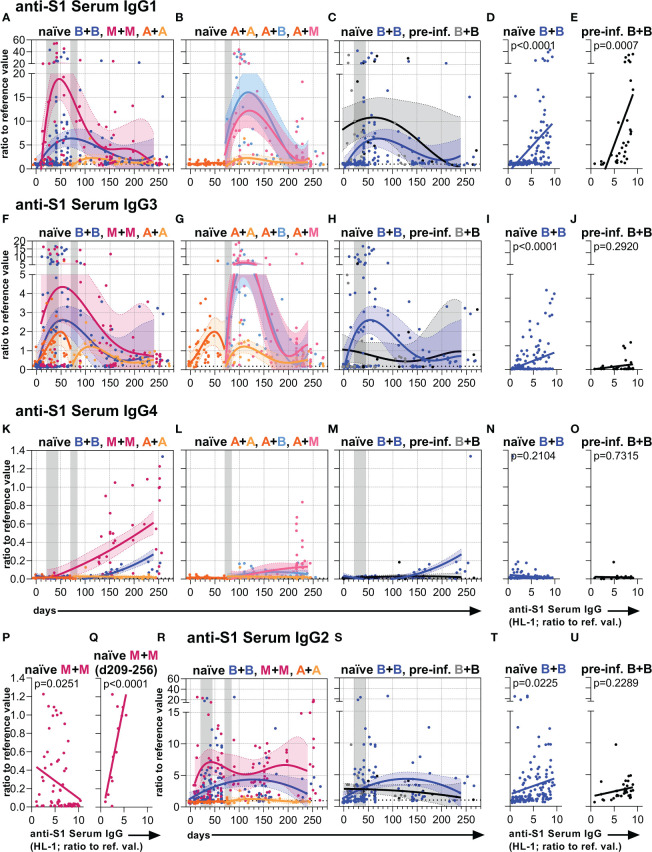
Anti-S1 serum IgG1-4 subclass levels. Anti-S1 serum (A–C) IgG1, (F–H) IgG3, (K–M) IgG4, and (R, S) IgG2 levels (ratios to reference values) of the indicated six vaccination groups. The A+B and A+M groups were not analyzed for IgG2. The used color codes are identical to Figure 1D . Gray bars: time windows of the second shot after the first shot with an mRNA (between day 21 and 45) or adenovirus-based (between day 70 and 84) vaccine. Dotted lines indicate the corresponding average anti-S1 IgG1, IgG3, IgG4, or IgG2 levels of non-vaccinated healthy (negative) controls. (D, E, I, J, N–Q, T, U) Pearson correlations between anti-S1 serum IgG levels (HL-1) and anti-S1 serum (D, E) IgG1, (I, J) IgG3, (N–Q) IgG4, or (T, U) IgG2 levels (y-axis as in (A, F, K or R, respectively)) of all paired samples from one and two-times BNT162b2-vaccinated (D, I, N, T) naïve and (E, J, O, U) pre-infected individuals, and (P, Q) two-times mRNA-1273-vaccinated naïve individuals. The IgG to IgG4 correlation in (Q) was only done with paired long-term samples of two times mRNA-1273-vaccinated naïve individuals collected between day (d) 209 and 256 upon the first immunization. p-values of the indicated correlations are shown.

