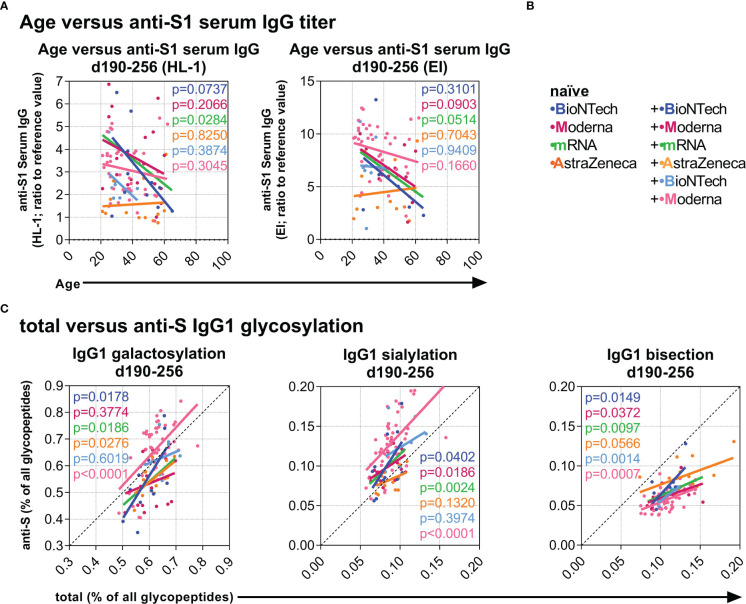
Figure 6.
Investigation of potential predictive parameters. (A) Negative correlations between age and late anti-S1 IgG titers (samples collected between day (d) 190 and 256 upon first vaccination) (Left: HL-1 ELISA data; Right: EUROIMMUN (EI) ELISA data) of the indicated vaccination groups. (B) Color legend of the six naïve groups; the mRNA group includes both naïve B+B- and M+M-vaccinated individuals. (C) Positive correlations between total and anti-S IgG1 galactosylation, sialylation, and bisection levels from samples collected late between day (d) 190 and 256.

