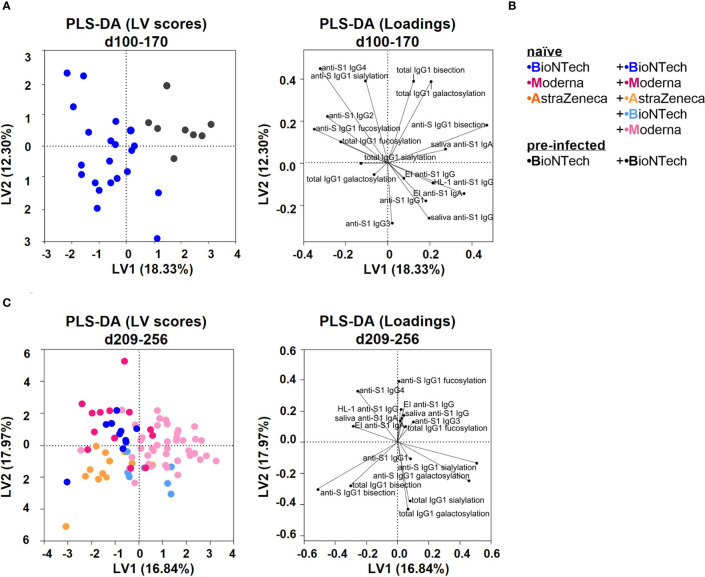
Figure 7.
Partial least squares-discriminant analysis (PLS-DA) of the study groups (A) PLS-DA of data collected from the naïve and pre-infected B+(B) vaccination cohorts between day (d) 100 and 170 upon first vaccination. Latent variable (LV) scores and loadings are shown. The area under the receiver operating characteristic curve (AUROC) for cross-validation is 0.8810 for both groups. (B) Color legend of the six vaccination groups. (C) PLS-DA of data collected from all naïve vaccination cohorts between day (d) 209 and 256 upon first vaccination. The AUROC values for cross-validation are B+B: 0.8304, M+M: 0.8449, A+A: 0.7416, A+B: 0.8773, and A+M: 0.9094.

