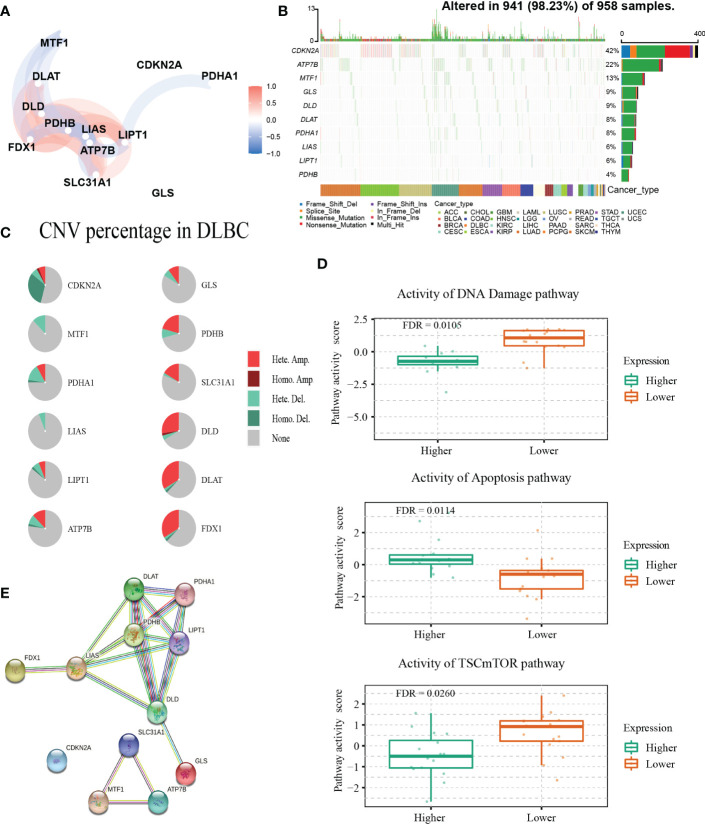
Figure 1.
Genetic alterations and interactions of CRGs in DLBCL. (A) The correlation network of 12 CRGs. The correlation coefficients are represented by different colors. (B) The tumor mutation burden frequency of CRGs in pan-cancer analysis. (C) The CNV percentage of 12 CRGs in DLBCL. (D) The associations between expression of SLC31A1 and activity of DNA damage and apoptosis pathway and the relationship between CDKN2A expression and mTOR pathway activity in DLBCL. (E) The PPI network encoded by CRGs in DLBCL. CNV, copy number variation; PPI, protein-protein interaction.

