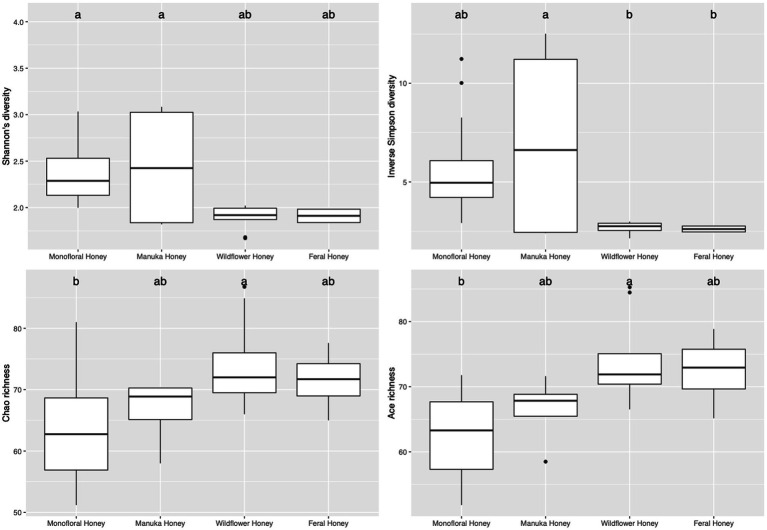
Figure 4.
Alpha diversity metrics of honey bacterial community. Diversity was measured with Shannon and inverse Simpson indices. Richness was measured with Chao and ACE indices. Comparison between honey sample types was performed with ANOVA and Tukey’s honest significance test. Letters above the bar plots represented shared significance groups (p-value cutoff is 0.05).

