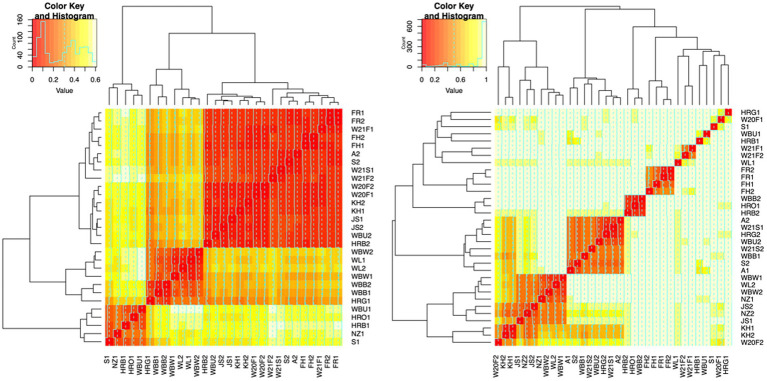
Figure 6.
Heat maps of Bray-Curtis distances between honey bacterial and fungal community. Left: bacterial community. Right: fungal community. Each line and column represented a honey sample. The degree of similarity based on Bray–Curtis distances was represented by the color and dendrogram. Color red represented high similarity while light yellow represented low similarity. Samples grouped together in the dendrogram were highly similar. Color key and histogram in the top left corner of the heat map represented the distribution of Bray–Curtis distances. The distance of the line from the center of each color-cell is proportional to the distance value. Axis labels are colored based on honey type: monofloral (black), wildflower (red), manuka (green), feral (blue).

