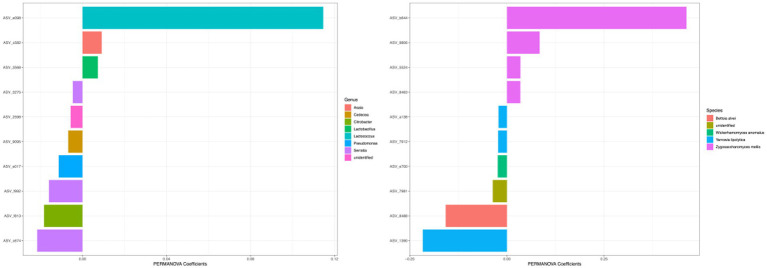
Figure 9.
Top coefficient amplicon sequence variants (ASVs) for beta diversity. Top bacterial and fungal ASVs that were associated with community differences between samples as estimated by Bray–Curtis dissimilarity were plotted. Color of each bar represented the genera for 16S ASVs and species for ITS ASVs. The top 10 ASVs with the highest PERMANOVA coefficient values were plotted.

