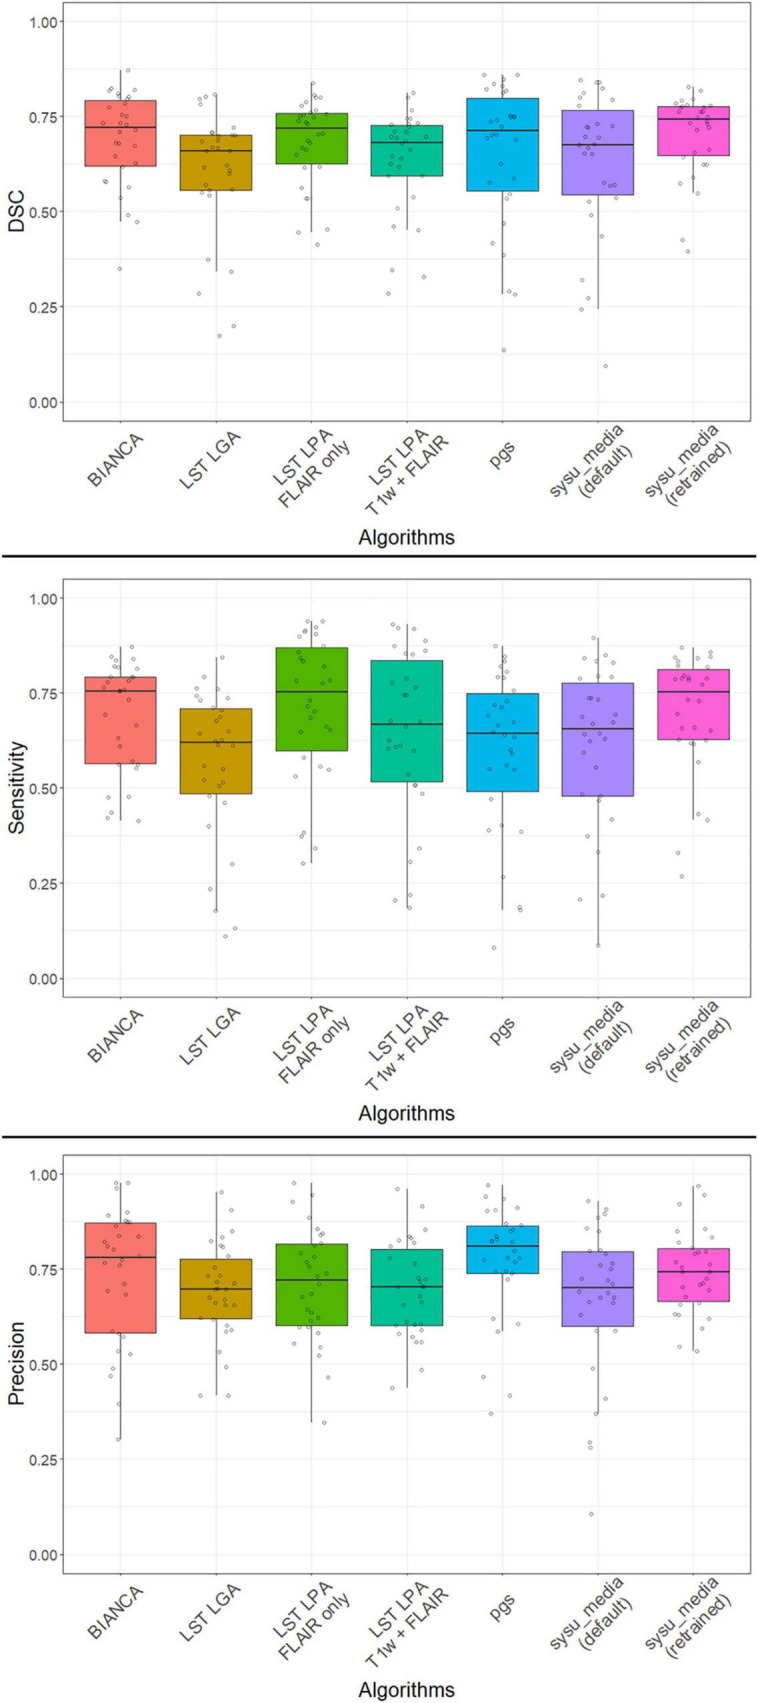
FIGURE 1.

Distribution of performances of all algorithms with DSC (top), sensitivity (middle), and precision (bottom) at volume level. The median, the 25–75 percentiles and all individual values are represented. DSC, Sørensen-Dice similarity coefficient; T1w, T1-weighted image; FLAIR, fluid-attenuated inversion recovery image; BIANCA, brain intensity abnormality classification algorithm; LST LGA/-LPA, lesion segmentation toolbox for SPM using lesion growth algorithm/lesion prediction algorithms.
