
FIGURE 4.
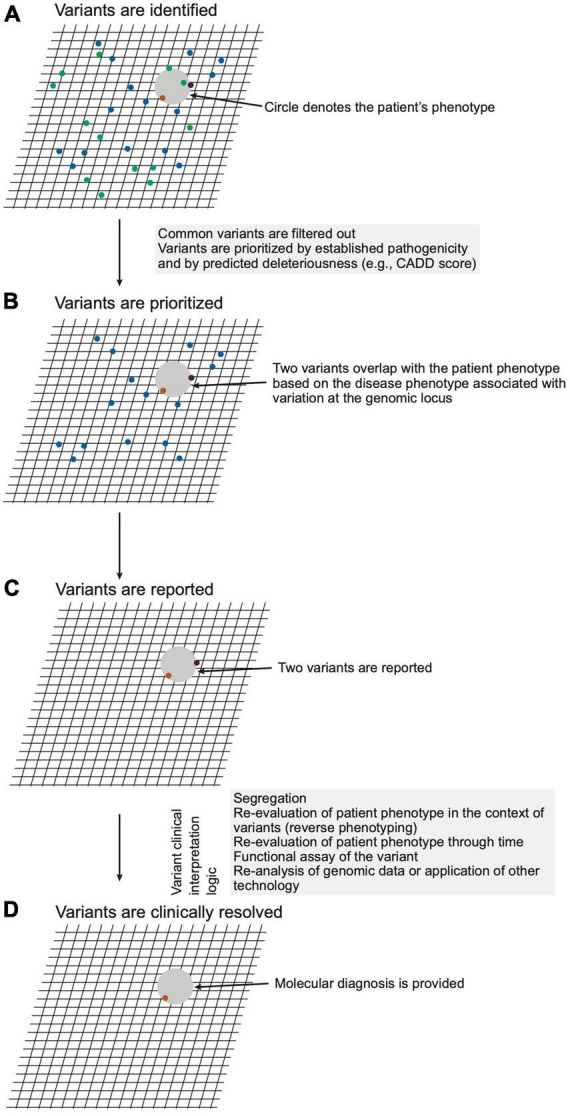
Schematic representation of variant analysis and resolution. (A) A hypothetical patient phenotype (gray circle) is plotted on an imaginary grid in relation to disease phenotypes associated with genomic loci within which the patient carries variants (ochre, purple, green dots). (B) Given that the patient has a rare disorder, variants with high unaffected population frequencies (green dots) are eliminated from consideration. (C) The remaining variants are filtered considering precedent (prior association with phenotype), variant type (e.g., non-synonymous, frameshift, premature stop), and in silico prediction of deleteriousness. The remaining two variants, which meet a threshold of potential deleteriousness and occur in loci associated with diseases phenotypically overlapping that of the patient, are prioritized and reported by the laboratory. (D) The CGS constructs a posterior probability for a diagnosis through review of the reported variants for evidence that variation of the genomic loci cause disease, for concordance of the patient phenotype with that of the diseases, and for genetic, molecular, and biochemical congruence of the variant with the disease mechanism. For this hypothetical patient, the clinical genomic specialists (CGS) judges one variant (ochre dot) a sufficient sole molecular diagnosis.