
Figure 1.
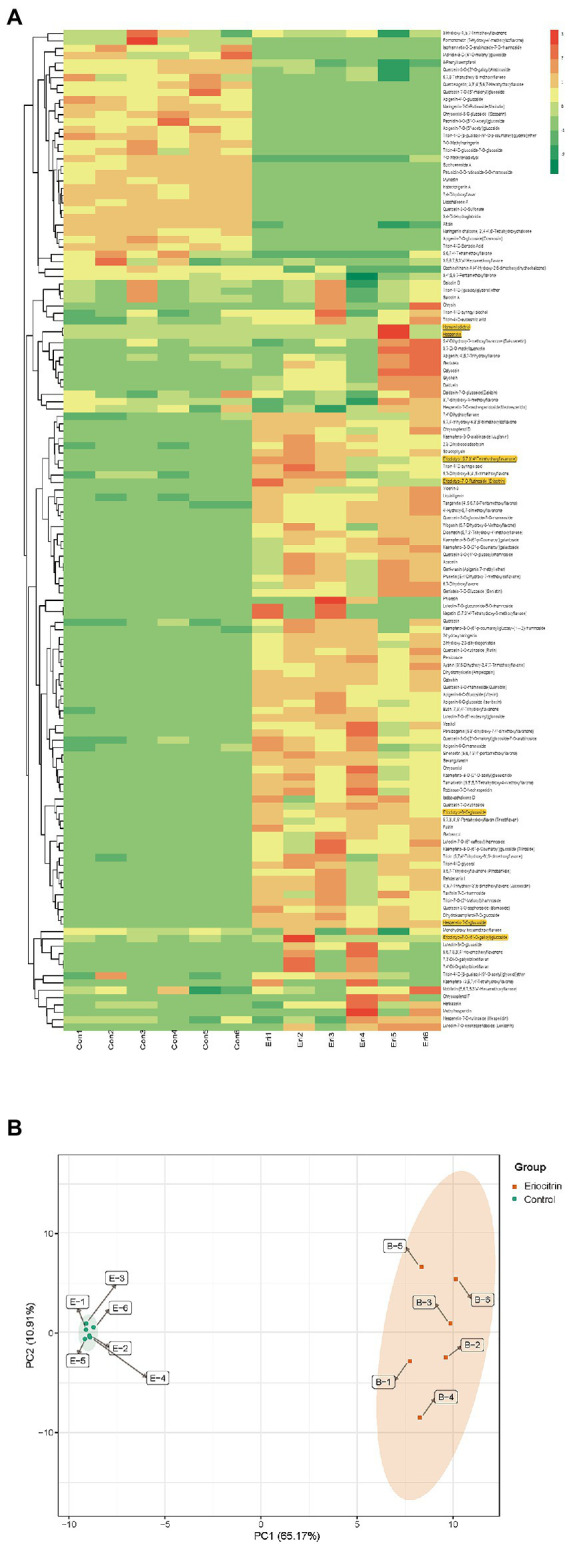
Differential flavonoid metabolite analysis on the basis of clustering heatmap and principal component analysis (PCA). (A) Clustering heatmap of all flavonoid metabolite, the metabolite content data was normalized by maximum difference normalization method. Each sample is visualized by a separate column and each metabolite is represented by a separate row, up-regulated and down-regulated metabolites are expressed in shades of red and green, respectively. (B) PCA score plot. Eir, eriocitrin; Con, control.