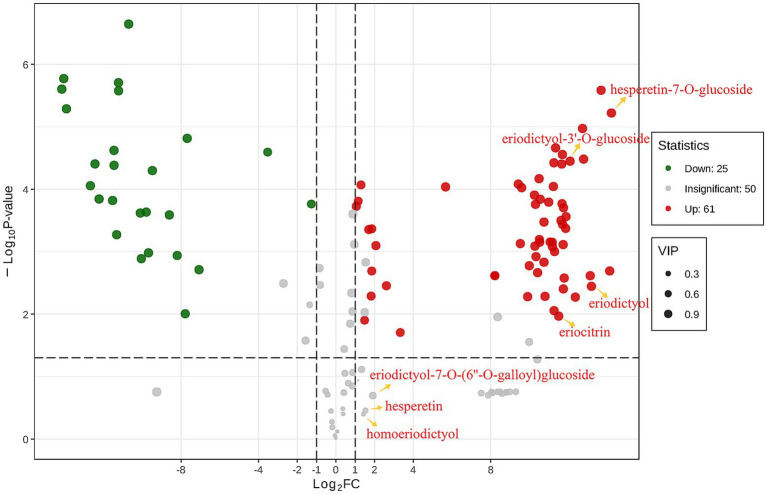
Figure 2.
Differential metabolites analyses for control group vs. eriocitrin group by criteria set at FC ≥ 2 or ≤ 0.5, VIP ≥ 1 and p < 0.05. each point in the figure represents a metabolite, where red and green points represent up-regulated and down-regulated differential metabolites, respectively, and gray points represent metabolites that were detected but not significantly different. The abscissa represents the logarithm of the relative content difference of a metabolite in the two groups of samples (log2FC), the ordinate represents the significance level of the difference (−log10P-value), and the size of the dot represents the VIP value.

