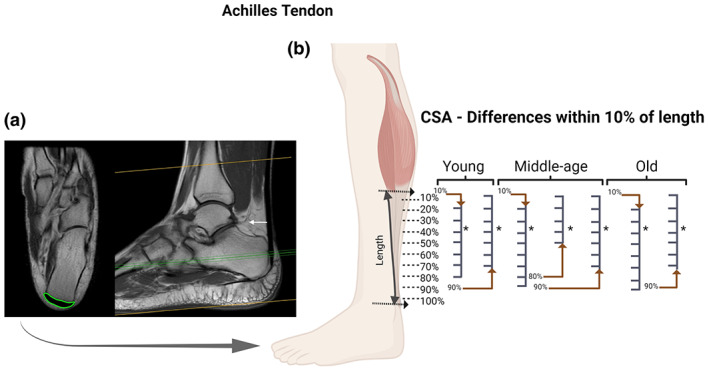
FIGURE 1.

Achilles tendon (AT): Axial and coronal T1 MRI images (cross‐sectional area [CSA] measurement in “green” and white arrow pointing to the location of the proximal landmark) (a); and statistical differences identified between specific regions of the AT with CSA measurements at every 10% of tendon length in each age group (b). For the AT we observed region‐specific differences in the CSA along the length of the tendon within the three groups. BioRender web‐based software was used to create the figure (license number MT23TQ8O9Z)
