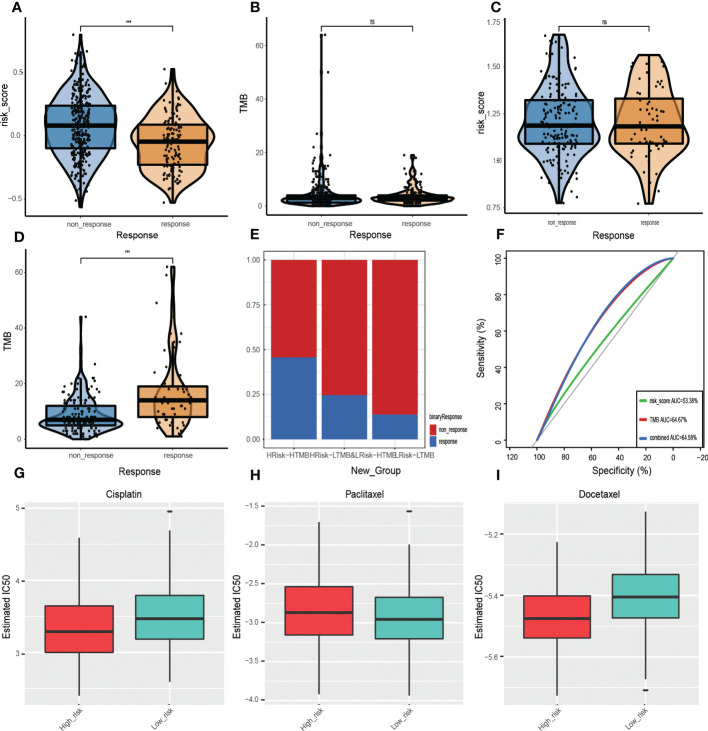
Figure 10.
Prognostic value of ICI therapy. (A, B) Sizes of training cohort responses, non-response sample GRGPIs, and TMB values. (C, D) Differences in GRGPIs and TMB between responsive and non-responsive samples from IMvigor210. (E) Proportions of immunotherapy-responsive and non-responsive samples in the three subgroups from the IMvigor210 cohort. (F) ROC curves of GRGPI, TMB, and GRGPI combined with TMB in the IMvigor210 cohort. Analysis of drug sensitivity. Differences in IC50 values of (G) Gefitinib, (H) Erlotinib, and (I) Cisplatin in the high-GRGPI group and low-GRGPI group.

