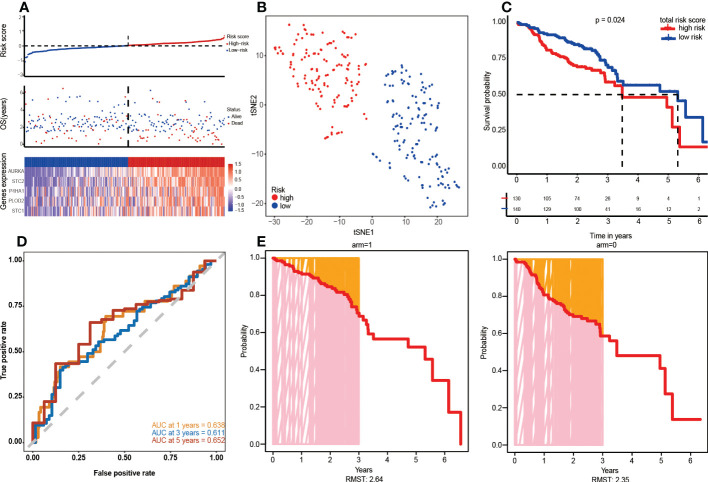
Figure 4.
Verification of the five-gene signature in the validation cohort (GSE65858). (A) Risk map of patients based on risk score heatmap of survival status and risk gene expression profiles of individual HNSCC patients. (B) t-SNE grouping cluster. (C) Kaplan–Meier curves according to the five-gene signature. Log-rank tests were performed to determine the p values. (D) ROC curve and AUC values of five-gene feature classification in GEO. (E) RMST plot for the GEO testing set.

