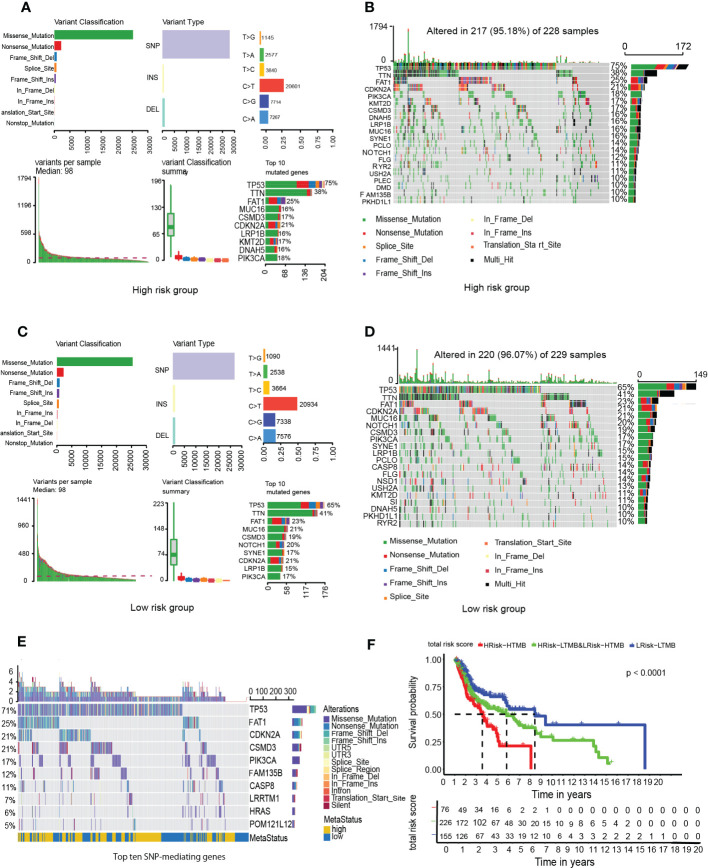
Figure 7.
Analysis of tumor mutation burden among HNSCC patients. (A) High-GRGPI. (B) High-GRGPI group mutation types and top 20 mutated genes in the sample. (C) Low-GRGPI. (D) low-GRGPI group top 20 mutated genes. (E) Mutation types of the top ten SNP-driven genes and their distribution in high-GRGPI group and low-GRGPI group. (F) Kaplan-Meier survival curve showing OS differences among the three subgroups.

