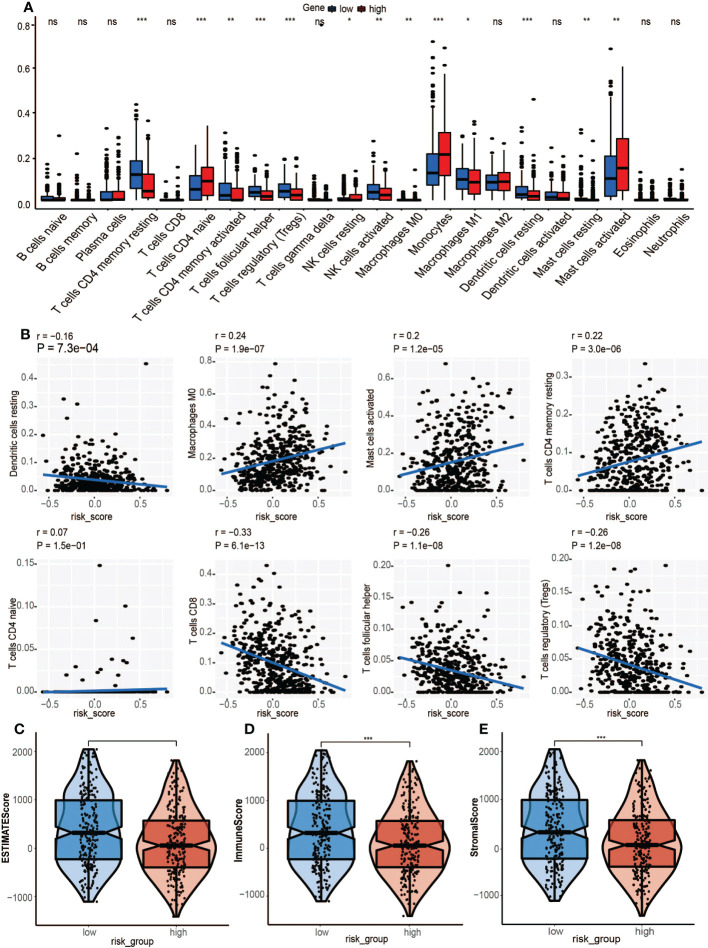
Figure 8.
Association between tumor immunity and GRGPI scores in high and low GRGPI groups. (A) The 22 infiltrating immune cells are shown in boxplots. (B) Correlation analysis between 8 types of infiltrating immune cells and GRGPI scores. (C–E) Boxplots showing the correlation between GRGPI with ESTIMATE, immune, and stroma scores of HNSCC samples. (ns, not significant, *p < 0.05, **p < 0.01, ***p < 0.001).

