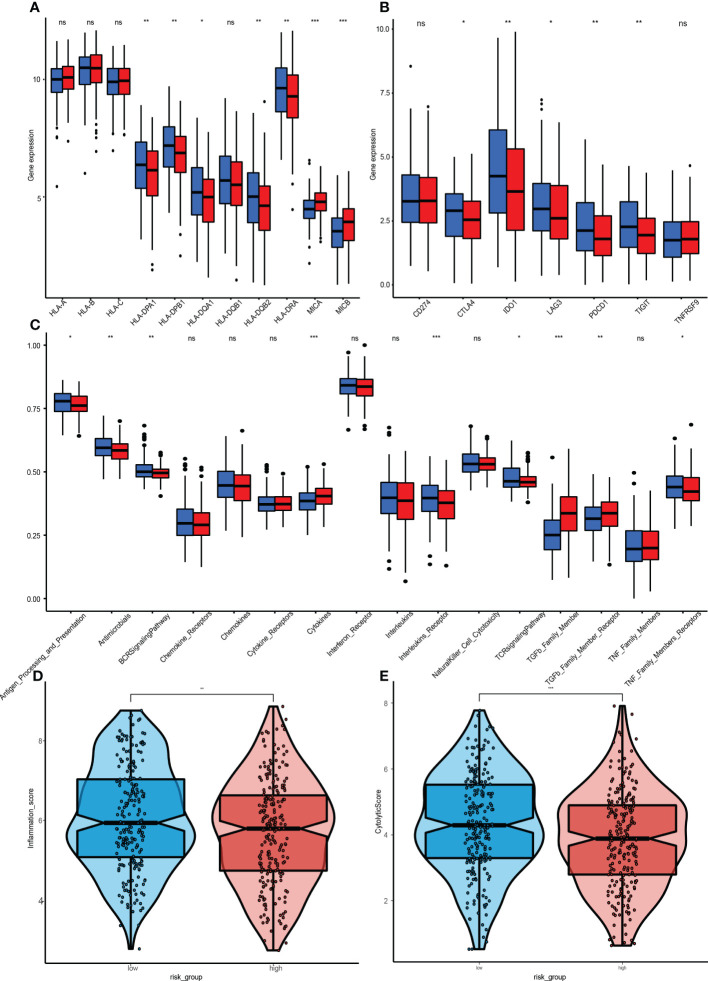
Figure 9.
Immunization between high and low risk groups. (A) Differential expressions of 11 HLA class immune checkpoints. (B) 7 genes. CD274, CTLA4, IDO1, LAG3, PDCD1, TIGIT, and TNFRSF between the high-GRGPI group and low-GRGPI group. (C) Immune-related pathways. (D, E) Violin diagram for differences in cytolytic activities and Tumor Inflammation Signature between the high-GRGPI and low-GRGPI groups. (ns, not significant, *P<0.05, **p < 0.01, **p < 0.001).

