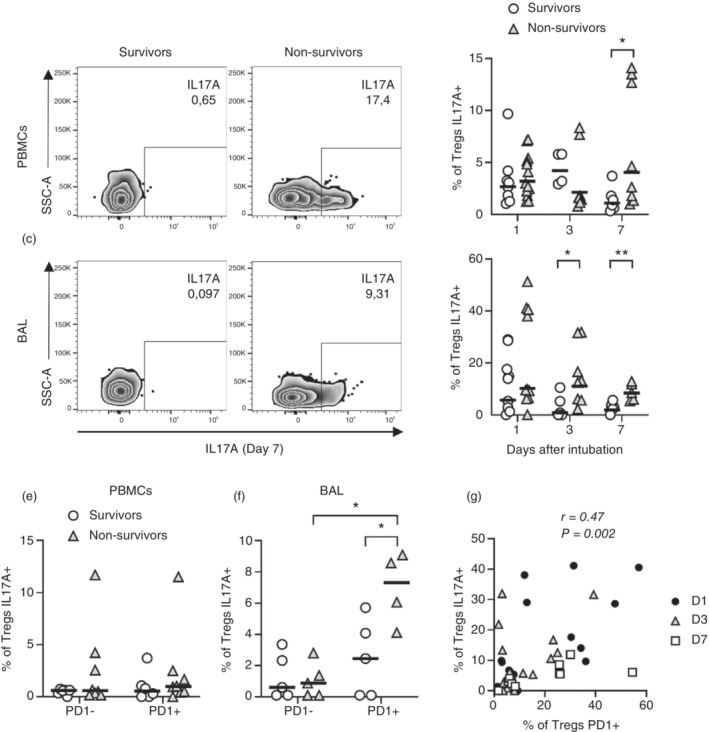
FIGURE 4.

Tregs of non‐survivors display higher production of IL‐17A associated with PD1 expression. PBMCs and BAL cells from patients with severe COVID‐19 were incubated for 12 h in the presence of BFA without stimulation and subjected to flow cytometry. Frequency of IL‐17A+ Tregs (a–d), influence of PD1 expression on IL‐17A production at Day 7 (e, f) and correlation between the frequency of Tregs producing IL‐17A and expressing PD1 (g) were evaluated. Representative dot plots of Tregs producing IL‐17A on Day 7 (a, c) are shown. Frequencies of Tregs in survivors (open circles) n = 9 (D1), n = 4 or 6 (D3) and n = 6 (D7) and non‐survivors (grey triangles) n = 10 (D1), n = 8 (D3) and n = 8 (D7) (b, d, e and f) were evaluated by geometric means and represented by horizontal lines. Differences between severe COVID‐19 groups were analysed by Mann–Whitney test and are indicated by asterisks (* for p < 0.05 and ** for p < 0.01) when statistically significant. All patients were included on correlation analysis from Days 1 (black circles), 3 (white triangles) or 7 (white square) after intubation (g). BAL, broncho‐alveolar aspirate; PBMC, peripheral blood mononuclear cell.
