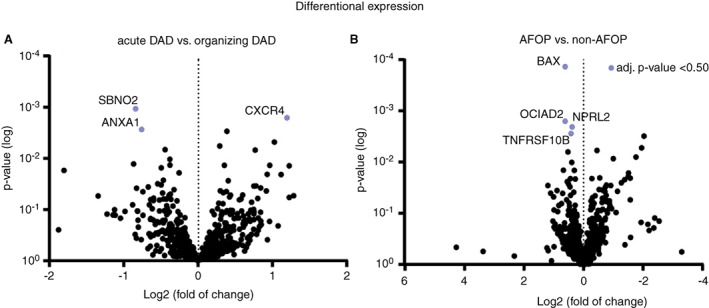
Figure 4.

Volcano plots displaying each gene's –log10 (P‐value) and log2 fold change based upon predominant DAD phase (A) and presence of AFOP (B). Genes with a negative fold change (left side) are up‐regulated in groups with either acute DAD or AFOP. Highlighted genes have an adjusted P‐value >0.50. AFOP, acute fibrinous and organising pneumonia; DAD, diffuse alveolar damage. [Color figure can be viewed at wileyonlinelibrary.com]
