Figure 5.

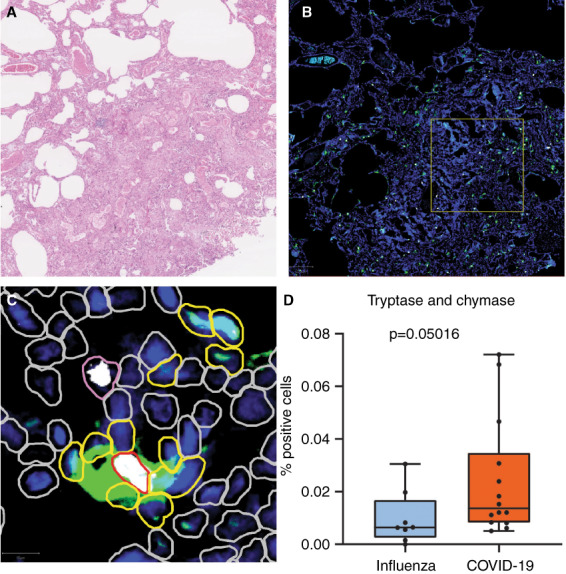
Multiplex immunofluorescence of tryptase and chymase. A, Haematoxylin and eosin staining of lung tissue. This case depicts lung tissue affected by COVID‐19. B, Multiplex immunofluorescence of the same area. Tryptase is stained green and chymase is stained white. Cell nuclei are stained blue by 4′,6‐diamidino‐2‐phenylindole (DAPI). The yellow square depicts the hot‐spot selected for automated cell count. C, Enhanced view of hot‐spot. Cells detected by QuPath are encircled. Yellow border: tryptase‐positive cells. Pink border: chymase‐positive cells. Red border: tryptase‐ and chymase‐positive cells. Grey border: tryptase‐ and chymase‐negative cells. D, Box‐plot of tryptase‐ and chymase‐positive cells; the y‐axis depicts the percentage of double‐positive cells from the total cells.
