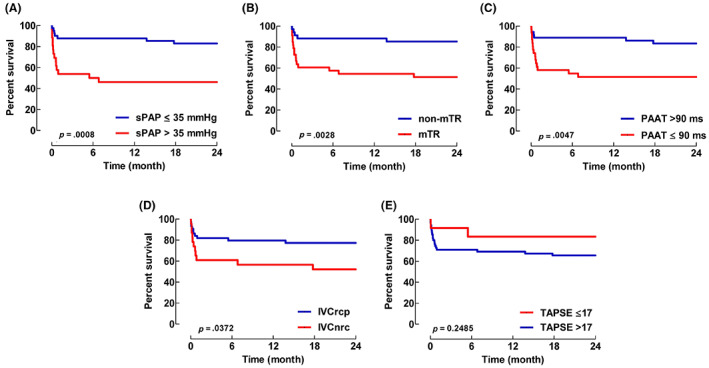
FIGURE 2.

K‐M survival plots for echocardiographic parameters for time period 0–24‐months. The number of patients at the time points 0, 1‐ and 24‐months were 26 versus 41, 14 versus 36, 12 versus 34, in groups sPAP >35 mmHg and sPAP ≤35 mmHg, respectively. Systolic pulmonary artery pressure (sPAP), measurable tricuspid valve regurgitation (mTR), pulmonary artery acceleration time (PAAT), no respiratory changes in the inferior vena cava (IVCnrc), and tricuspid annular plane systolic excursion (TAPSE), are shown in panels (A–E), respectively. IVCrcp, respiratory changes observed in inferior vena cava. p‐values based on K‐M statistics.
