Figure 1.

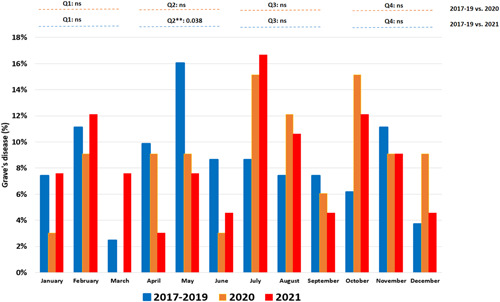
Percentage of cases of Graves' disease by month in 2017–2019, 2020 and 2021. Q1: January–March; Q2: April–June; Q3: July–August; Q4: October–December. NS, Not significant. [Color figure can be viewed at wileyonlinelibrary.com]

Percentage of cases of Graves' disease by month in 2017–2019, 2020 and 2021. Q1: January–March; Q2: April–June; Q3: July–August; Q4: October–December. NS, Not significant. [Color figure can be viewed at wileyonlinelibrary.com]