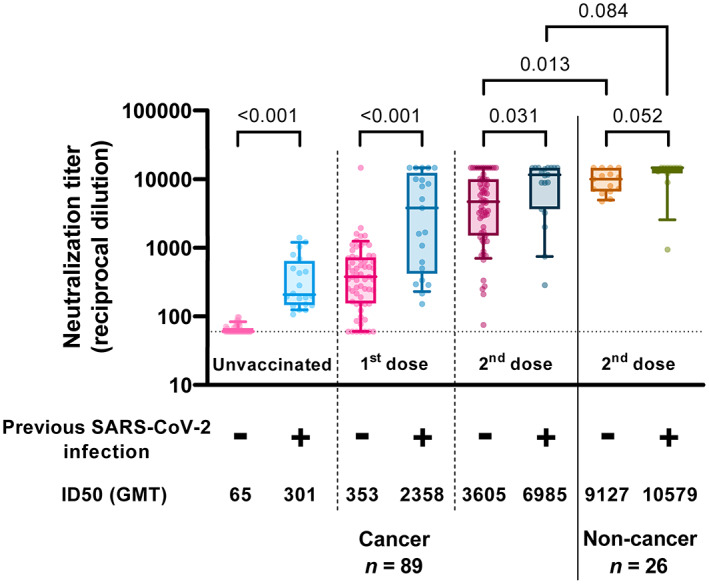
Fig. 2.

Neutralizing activity against WH1. Neutralization titers from participants' plasmas at different time points. Boxes show the median and the interquartile range (25th and 75th percentiles) and whiskers the 10th and 90th percentiles. P values correspond to Peto–Peto rank test with Benjamini & Hochberg adjustment. Below is indicated the previous SARS‐CoV‐2 infection status before vaccination. GMT, Geometric mean titer. Uninfected cancer patients n = 67; infected cancer patients n = 22; uninfected controls n = 15; infected controls n = 11.
