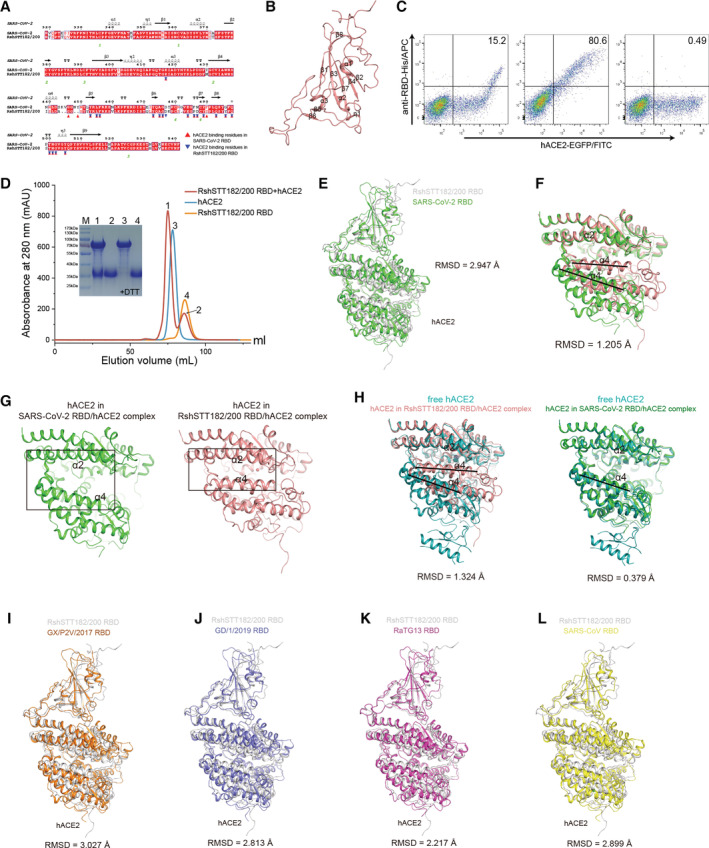
Figure EV1. The overall structure of the RshSTT182/200 RBD bound to hACE2.

-
AStructure‐based sequence alignment of the SARS‐CoV‐2 and RshSTT182/200 RBDs. The secondary structure elements were defined based on an ESPript (Robert & Gouet, 2014) algorithm and are labeled based on the SARS‐CoV‐2 RBD/hACE2 complex structure (PDB: 6LZG). Coils indicate α helices, and black arrows indicate β strands. Conserved residues are highlighted in red and residues in blue boxes are highly (80%) conserved. Residues of the SARS‐CoV‐2 RBD and RshSTT182/200 RBD that contact hACE2 through van der Waals interactions are marked with red regular triangles and blue inverted triangles, respectively. The sequence alignment was generated with SnapGene and ESPript.
-
BThe secondary structural elements of the RshSTT182/200 RBD are defined.
-
CFlow cytometry characterization of the RshSTT182/200 or SARS‐CoV‐2 RBDs binding to hACE2. The SARS‐CoV‐2 NTD was used as a negative control. The frequency of RBD‐positive cells in the hACE2‐eGFP‐positive cells is labeled in the upper right corner.
-
DGel filtration profiles of hACE2 (blue), the RshSTT182/200 RBD (saffron yellow), and the RshSTT182/200 RBD/hACE2 complex (red) were analyzed and are displayed. The separation profiles of each of the pooled samples on SDS–PAGE are shown.
-
EThe comparison of the overall structure of the RshSTT182/200 RBD/hACE2 complex compared to the SARS‐CoV‐2 RBD/hACE2 complex structure.
-
FStructural alignment of hACE2 in the RBD/ACE2 complexes. hACE2 in complex with the RshSTT182/200 RBD and SARS‐CoV‐2 RBD (PDB: 6LZG) is shown in salmon and green, respectively. The black lines show the difference between the open and closed states of the α4‐helix.
-
GThe α2‐helix and α4‐helix of hACE2 in the RshSTT182/200 RBD/hACE2 complex (closed state) and SARS‐CoV‐2 RBD/hACE2 complex (open state) are shown.
-
HStructural alignment of free hACE2 and hACE2 in the RBD/ACE2 complex. Free hACE2 (PDB: 1R42) is shown in teal.
-
I–LComparison of the overall structure of the RshSTT182/200 RBD/hACE2 complex with the SARS‐CoV RBD/hACE2 (PDB: 2AJF), GX/P2V/2017 RBD/hACE2 (PDB: 7DDP), GD/1/2019 RBD/hACE2 (PDB: 7DDO), or RaTG13 RBD/hACE2 (PDB: 7DRV) complex.
Source data are available online for this figure.
